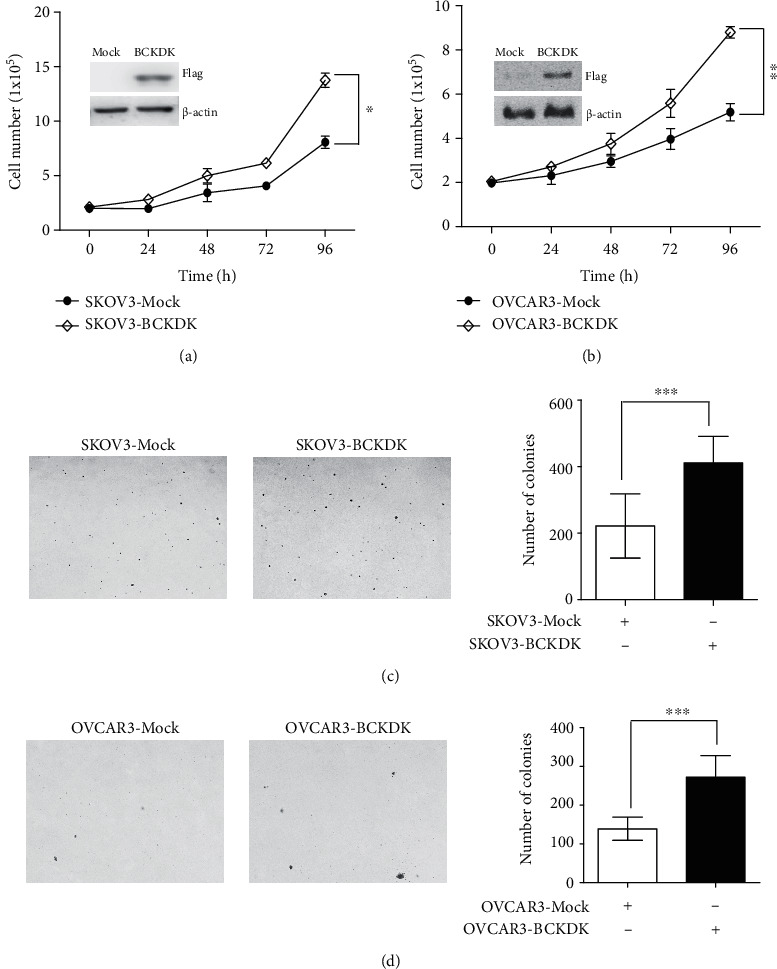
Figure 3.

BCKDK promotes OC cell proliferation. (a) Growth curves of vector control cells (SKOV3-Mock) and BCKDK-overexpressing cells (SKOV3-BCKDK). Insert shows verification of the cell lines identified by western blot. Data are represented as mean ± standard deviation from the triplicate experiments. The asterisk indicates a significant increase in cell number in SKOV3-BCKDK cells compared with SKOV3-Mock cells (∗P < 0.05). (b) Growth curves of vector control cells (OVCAR3-Mock) and BCKDK-overexpressing cells (OVCAR3-BCKDK). Insert shows verification of the cell lines identified by western blot. Data are represented as mean ± standard deviation from the triplicate experiments. The asterisk indicates a significant increase in cell number in OVCAR3-BCKDK cells compared with OVCAR3-Mock cells (∗∗P < 0.01). (c) BCKDK can transform SKOV3 cells ex vivo as illustrated by growth of BCKDK transformed cells in soft agar. Photomicrograph of representative colony formation in soft agar of vector control cells (SKOV3-Mock) compared with BCKDK-overexpression cells (SKOV3-BCKDK) is shown (∗∗∗P < 0.001). (d) BCKDK can enhance the transformation of OVCAR3 cells ex vivo as illustrated by growth of BCKDK transformed cells in soft agar. Photomicrograph of representative colony formation in soft agar of vector control cells (OVCAR3-Mock) compared with BCKDK-overexpressing cells (OVCAR3-BCKDK) is shown (∗∗∗P < 0.001).
