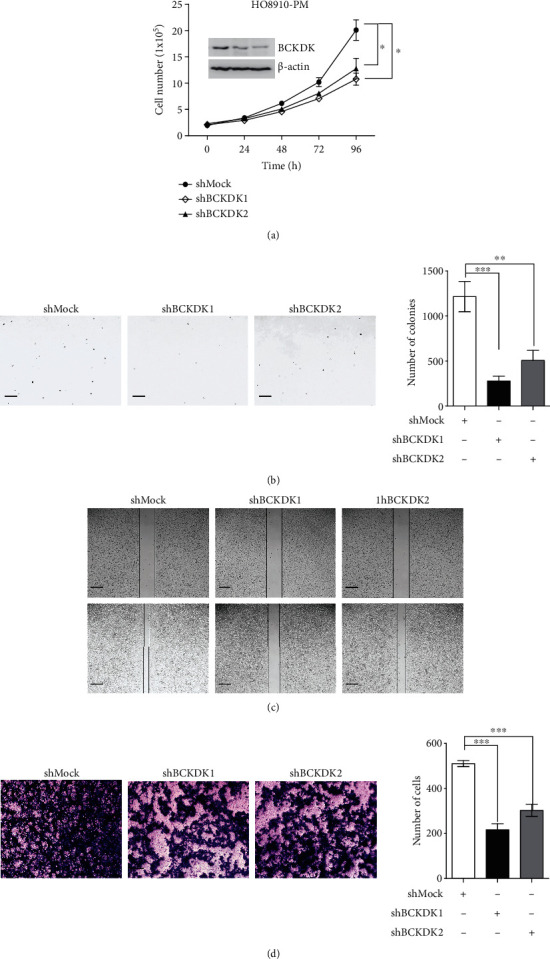
Figure 5.

Knockdown of BCKDK attenuates OC tumor properties ex vivo. (a) Growth curves of HO8910-PM-shMock, HO8910-PM-shBCKDK1, and HO8910-PM-shBCKDK2 cells. Insert shows verification of the knockdown cell lines identification by western blot. Data are represented as mean ± standard deviation from triplicate experiments. The asterisks indicate a significant increase compared with shMock cells (∗P < 0.05). (b) Knockdown of BCKDK reduces tumorigenic properties of HO8910-PM cells ex vivo. Representative photomicrograph of colony formation in soft agar of vector control cells (shMock) compared with BCKDK-knockdown cells (shBCKDK1 or shBCKDK2) is shown. Data are represented as mean ± standard deviation from triplicate experiments (∗∗P < 0.01 and ∗∗∗P < 0.001). (c) Scratch wound assay demonstrating that HO8910-PM-shMock migrate faster than HO8910-PM-shBCKDK1, 2 cells. The dotted lines show the area where the scratch wound was created. The scratch wound assay was performed in triplicate experiments. (d) Transwell assay. HO8910-PM-shMock have greater migration capacity than HO8910-PM-shBCKDK1, 2 cells. Representative images from transwell assays of HO8910-PM-shMock cells and HO8910-PM-shBCKDK1, 2 cells, are shown.
