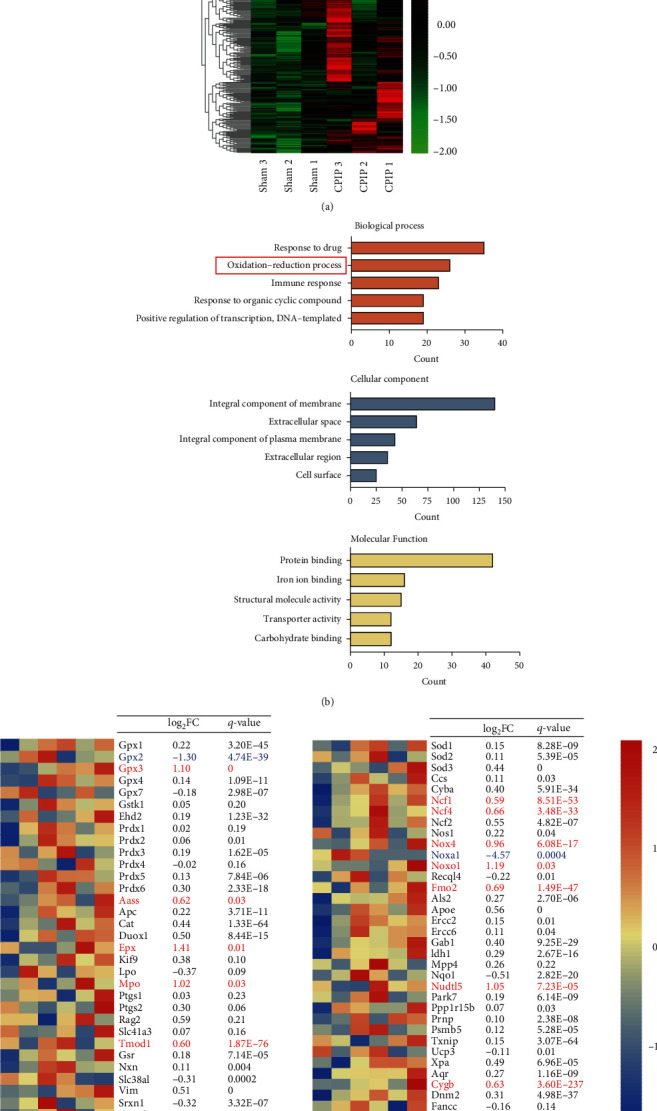
Figure 2.

RNA-Seq profiling of gene expression in local ipsilateral hindpaw tissues of CPIP model rats. (a) Heat map showing hierarchical clustering patterns of DEGs from the control and CPIP model groups. (b) Gene Ontology (GO) pathway analysis of DEGs. The top 5 mostly enriched pathways were illustrated. (c) Heat map summarizing the genes particularly involved in oxidative stress, antioxidant defense, and reactive oxygen metabolism process as well as corresponding log2FC (FC: fold change) and q value. Upregulated DEGs are displayed in red, whereas downregulated are in blue. Non-DEGs are in black. n = 3 rats/group.
