. 2020 Jun 8;10(37):21907–21913. doi: 10.1039/d0ra03799k

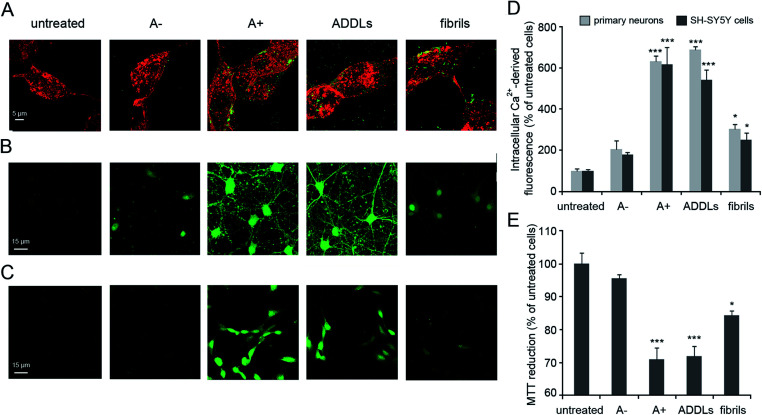
Fig. 1. Aβ42 cellular internalization and cytotoxicity. (A) Representative STED images of differentiated SH-SY5Y cells treated with the indicated Aβ42 species for 1 h at a concentration of 3 μM (monomer equivalents). Red and green fluorescence indicates the cell membranes stained with wheat germ agglutinin (WGA) and the Aβ42 species stained with primary and secondary antibodies. (B and C) Representative confocal microscope images showing the Ca2+-derived fluorescence in primary rat cortex neurons (B) and differentiated SH-SY5Y cells (C) treated for 15 min with the indicated Aβ42 species at a concentration of 3 μM. The cells were loaded with the Fluo-4 AM probe. (D) Semi-quantitative analysis of the Ca2+-derived fluorescence, expressed as percentages of the values for untreated cells. (E) MTT reduction in differentiated SH-SY5Y cells treated for 24 h with the indicated Aβ42 species at a concentration of 3 μM (monomer equivalents). Experimental errors are S. E. M. (n = 18 for MTT and 12 for confocal experiments). Samples were analysed by one-way ANOVA followed by Bonferroni's multiple comparison test relative to untreated cells (*P < 0.05 and ***P < 0.001). A total of 40–60 (A), 100–150 (B–D) and 150 000–200 000 (E) cells were analysed per condition in total.

Fig. 1