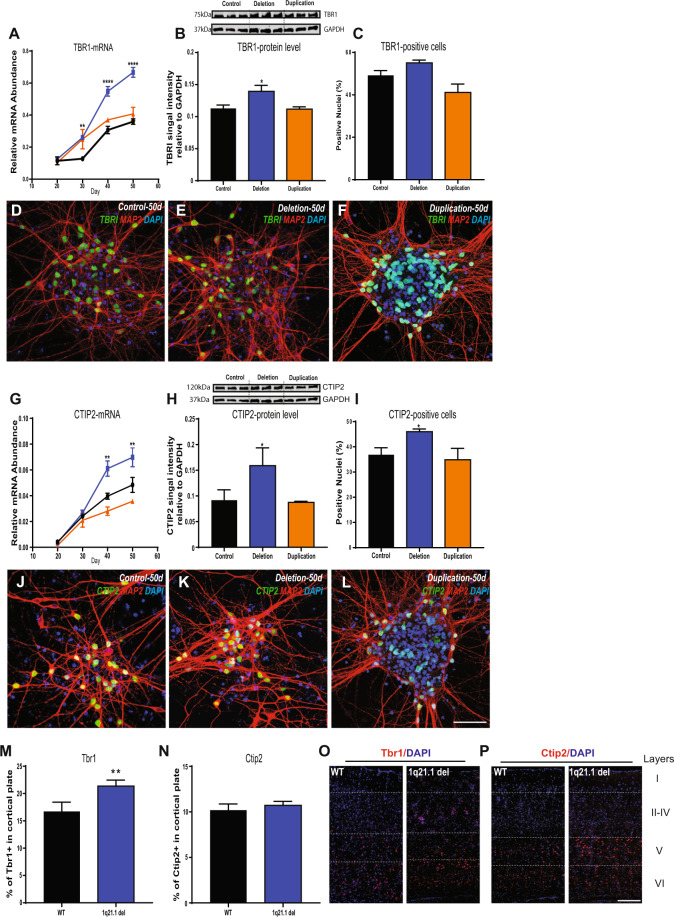
Fig. 2. Deletion or duplication of the 1q21.1 locus is associated with aberrant cortical neuron differentiation similar to deficits found in the 1q21.1 microdeletion mouse model.
A Gene expression of cortical deep layer marker TBR1 through the course of the neuronal differentiations (from day 20 to day 50). Both genotype (F2,84 = 57.55; P < 0.0001; n ≥ 3/group) and time (F3,84 = 365.8; P < 0.0001; n ≥ 3/group) had significant effects on TBR1 expression. B Representative western blot protein bands and quantitative analysis of TBR1 expression normalised to GAPDH (n ≥ 3). C Quantification of the percentage of MAP2 positive cells which co-localised with TBR1 (n ≥ 3). D-F Representative images of MAP2 and TBR1 colocalization from a control, deletion and duplication cell line. G The expression of CTIP2 through the course of neuronal differentiation (from day 20 to day 50). Both genotype (F2,84 = 199.7; P < 0.0001; n ≥ 3/group) and time (F3,84 = 133.2; P < 0.0001; n ≥ 3/group) had significant effects on CTIP2 expression. H Representative western blot protein bands and quantitative analysis for CTIP2 expression normalised to GAPDH (n ≥ 3). I Quantification of the percentage of MAP2 positive cells which co-express CTIP2 (n ≥ 3). J-L Representative images MAP2 and CTIP2 colocalization from a control, deletion and duplication cell line. Scale bar = 100 µm. Data sets are expressed as mean of at least three independent experiments and were analysed by Students T-Test or two-way ANOVA with post hoc comparisons using Dunnett’s multiple comparisons test comparing to control samples. Where appropriate stars above points represent Dunnett-corrected post hoc tests. M Quantification of TBR1+ nuclei in the somatosensory cortex of adult mice modelling 1q21.1 deletion and wild type liter matched controls (WT) given as a percentage of nuclei in a 300 µm section of cortex. N Quantification of CTIP2+ nuclei in the somatosensory cortex of adult mice modelling 1q21.1 microdeletion and liter matched controls given as a percentage of nuclei in a 300 µm section of cortex. Data were analysed using Student’s T-tests with six animals per group and n ≥ 3 for each animal. All data are presented as means ± SEM *P < 0.05; **P < 0.01; ***P < 0.001 ****P < 0.0001 vs. control. O Representative images of a coronal brain section of wild type (WT) and 1q21.1 microdeletion model (1q21.1) showing the expression of Tbr1+ cells in the somatosensory cortex of 1-month old adult mice. P Representative images of a coronal brain section of wild type (WT) and 1q21.1 microdeletion model (1q21.1) showing the expression of Ctip2+ cells in the somatosensory cortex of 1-month old adult mice. Scale Bar = 100 µm.

