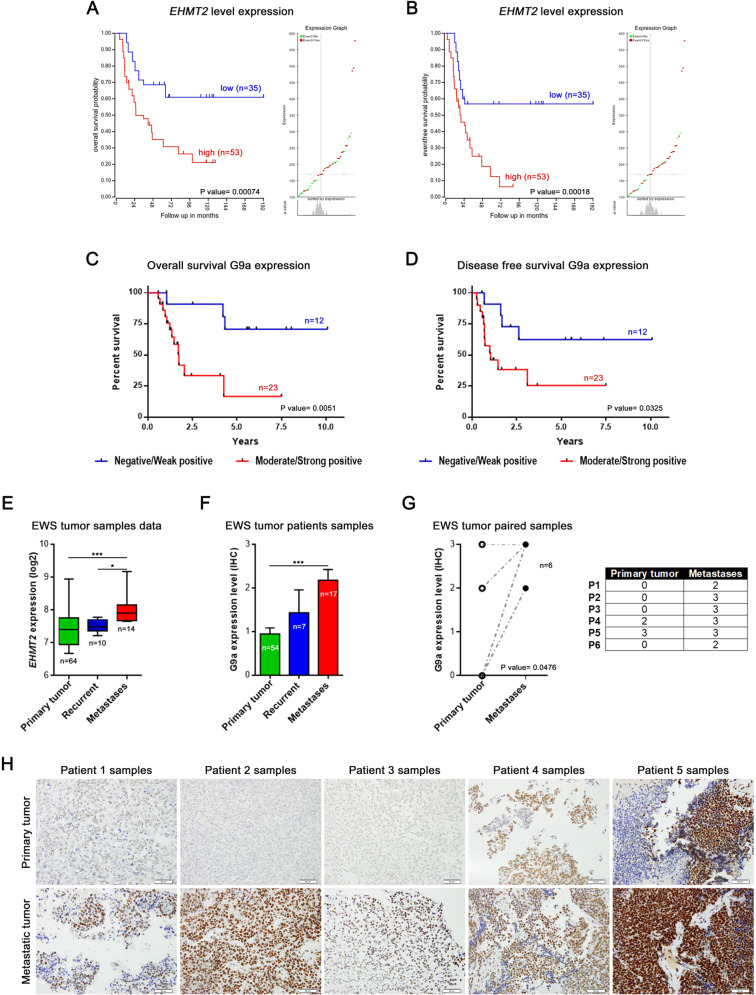
Fig. 1. EHMT2/G9a overexpression correlates with poor prognosis in EWS patients.
EHMT2 Kaplan–Meier curves of overall survival (A) and disease-free survival (B), according to the transcriptional expression in EWS patient samples (R2 Savola data). G9a Kaplan–Meier curves of overall survival (C) and disease-free survival (D), according to the protein expression in primary EWS patient samples. E Comparison of the EHMT2 mRNA level expression between primary, recurrent and metastatic EWS patient samples (R2 Savola data). F G9a expression levels in primary, recurrent and metastatic EWS patient samples. G G9a protein expression levels comparison between primary and metastatic paired EWS patient samples. Comparisons of G9a protein level of paired samples (right table). H Immunohistochemical staining of G9a in EWS paired tumor samples (20× magnifications). *p < 0.05; **p < 0.01; ***p < 0.001.

