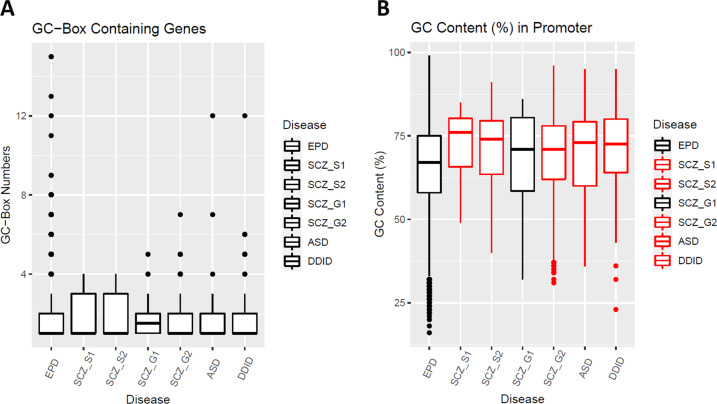
Fig. 2. The GC-boxes and the GC content in the proximal promoter region (−140,−41).
SCZ_S1 (SCHEMA1, risk-genes with p < 10−4), SCZ_S2 (SCHEMA2, risk-genes with p < 10−3), SCZ_G1 (GWAS1, FINEMAP prioritized genes), SCZ_G2 (GWAS2, all prioritized genes). A The numbers of the GC-boxes in the proximal promoter region (−140,−41) of the GC-box containing genes were boxplotted in different groups of genes. Permutation tests showed no significant difference between the EPD group and any of the disease groups. B The GC content in the proximal promoter region (−140,−41) was calculated for each gene. Welch’s t tests were used for statistical analysis (Supplemental Table S4). All of the risk-gene groups except SCZ_G1 (black) have a significantly higher GC content than the EPD group after FDR correction of multiple comparisons.

