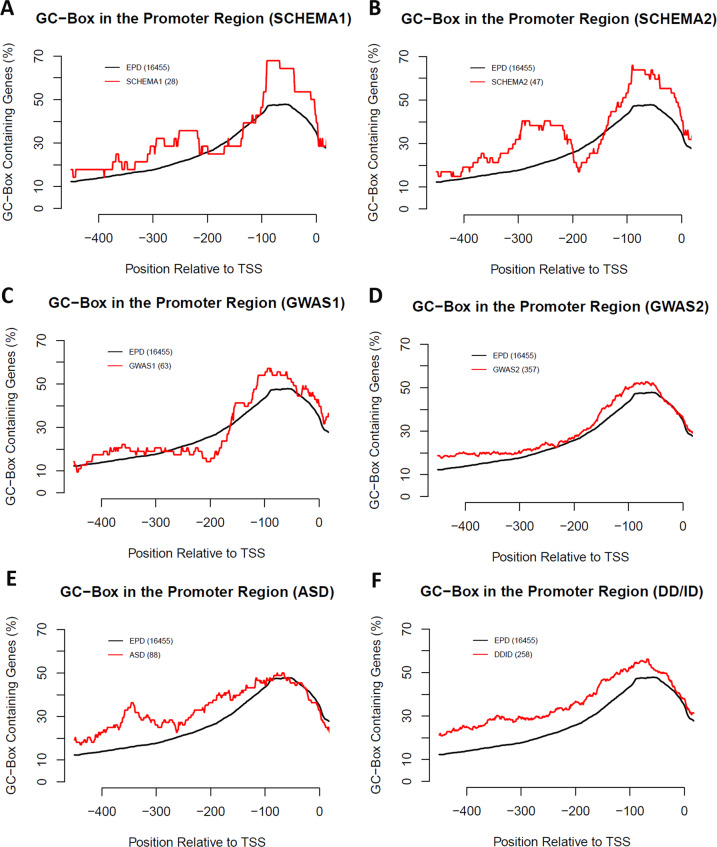
Fig. 3. The GC-boxes upstream of the proximal promoter region (−140,−41).
Due to the small sample sizes of schizophrenia-risk genes, a large window size (100 nucleotides) was used to scan the frequency of the GC-boxes across the promoter regions (−500,50) with 1 nucleotide window shift. The percentages of the GC-box containing genes in each window were plotted for the control EPD and each group of disease genes in SCHEMA1 (A), SCHEMA2 (B), GWAS1 (C), GWAS2 (D), ASD (E), and DD/ID (F).

