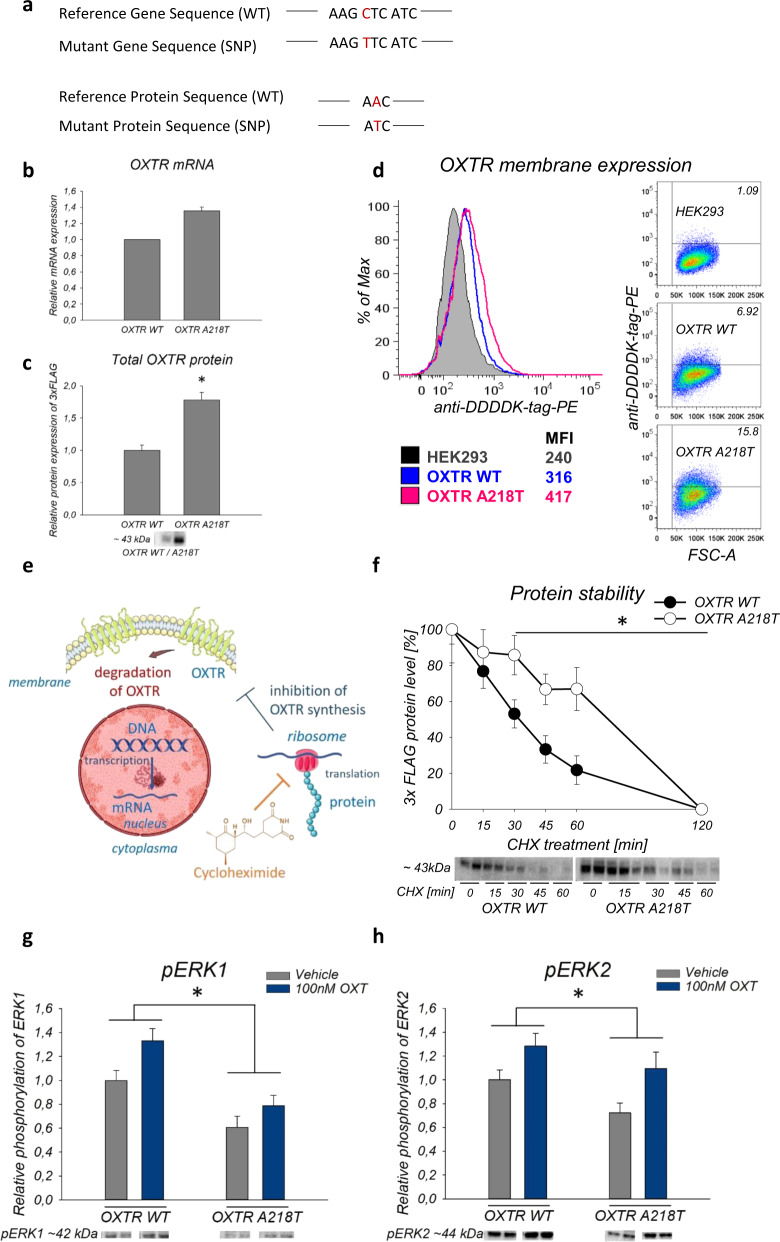
Fig. 1. Inherent properties and intracellular effects of the wild-type (WT) and A218T oxytocin receptor (OXTR).
a Gene and protein sequence of WT and A218T OXTR. b Relative mRNA expression levels of the OXTR in A218T compared to WT cells analyzed by RNA sequencing. *padj < 0.001. c T-test revealed a significantly increased protein expression of the 3xFLAG tag in the whole cell lysate of A218T compared to WT cells. n = 6. *p = 0.005. d Flow cytometric determination of the surface expression level of the OXTR in WT and A218T cells. Values inside the flow cytometry plots represent the percentage of cells above and beyond a set threshold. Colored values under the histogram plot show the mean fluorescence intensity (MFI). FSC-A: forward scatter area. e Scheme of cycloheximide (CHX) inhibition effect on protein translation. The schematic art pieces used in this figure were provided by Servier Medical Art (https://smart.servier.com) licensed under a Creative Commons Attribution 3.0 Unported License. f Quantification of 3xFLAG levels after CHX treatment as percentage of the initial protein level (0 min of CHX treatment). Two-way ANOVA revealed a significant effect between the cell lines in the protein stability evaluated by CHX assay. n = 4 and 6 for each data point. *p (cell line) = 0.002. *p (treatment) < 0.001. g, h Quantification of western blot results showing relative phosphorylation level of ERK1 and ERK2 in the OXTR WT and A218T cell line after stimulation with 100 nM oxytocin (OXT) for 1 h. Direct comparison of the cell lines revealed that the OXTR A218T cells show a lower phosphorylation level than the OXTR WT cells independent of the treatment (Vehicle = gray bars/OXT = blue bars). *p < 0.049. n = 10 per group. b, c, f, g, h Data are shown as mean ± SEM. Band intensity was normalized by whole lane staining using the “Stain-Free” method (© Bio-Rad).

