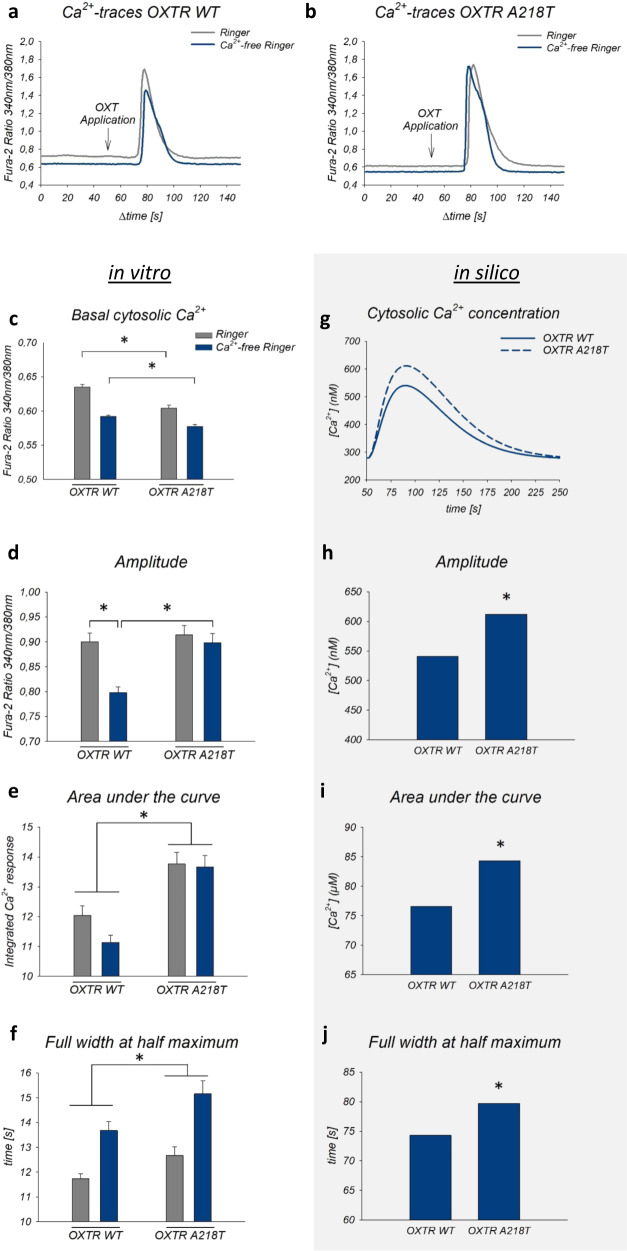
Fig. 2. Intracellular Ca2+ dynamics in the oxytocin receptor (OXTR) wild-type (WT) and A218T variant in vitro and in silico.
a, b Representative Ca2+-traces of OXTR WT or A218T cells upon stimulation with 100 nM oxytocin (OXT) in Ca2+-containing (gray line) or Ca2+-free (blue line) Ringer’s solution. Ca2+ levels were analyzed as fluorescence ratio at 510 nm after excitation at 340 and 380 nm. c Basal cytosolic Ca2+ levels of OXTR WT and A218T cells reflected by Fura-2 340 nm/380 nm ratios under both conditions. *p < 0.001. d Mean amplitude of OXT-induced Ca2+-signals in Ca2+-free and Ca2+-containing Ringer’s solution in WT and mutant cells. *p < 0.001. Interaction between cell line and treatment (± Ca2+) *p = 0.01. e Mean area under the curve calculated as integral over time above baseline in OXTR A218T compared to OXTR WT cells under both conditions. *p < 0.001. f Two-way ANOVA revealed a main effect between the cell lines regarding the full width at half maximum (FWHM). *p = 0.02. g Graphical representation of the simulation curves of Ca2+ concentration upon stimulation with OXT in Ca2+-free Ringer’s solution. h Maximal amplitude of OXT-induced Ca2+ simulation curves’ peaks of OXTR WT and OXTR A218T. ∗ ratio = 1.13. i Area under simulation’s curves of OXTR WT and A218T. ∗ ratio = 1.10. j FWHM of the OXT-induced Ca2+ simulation’s curves of OXTR WT and OXTR A218T. ∗ ratio = 1.07. c–f Bars show mean + SEM in presence (gray bars) or absence (blue bars) of extracellular Ca2+. Two-way ANOVA with sample size for graphs: n (OXTR WT + /−Ca2+) = 91/96, n (OXTR A218T + /−Ca2+) = 63/89.

