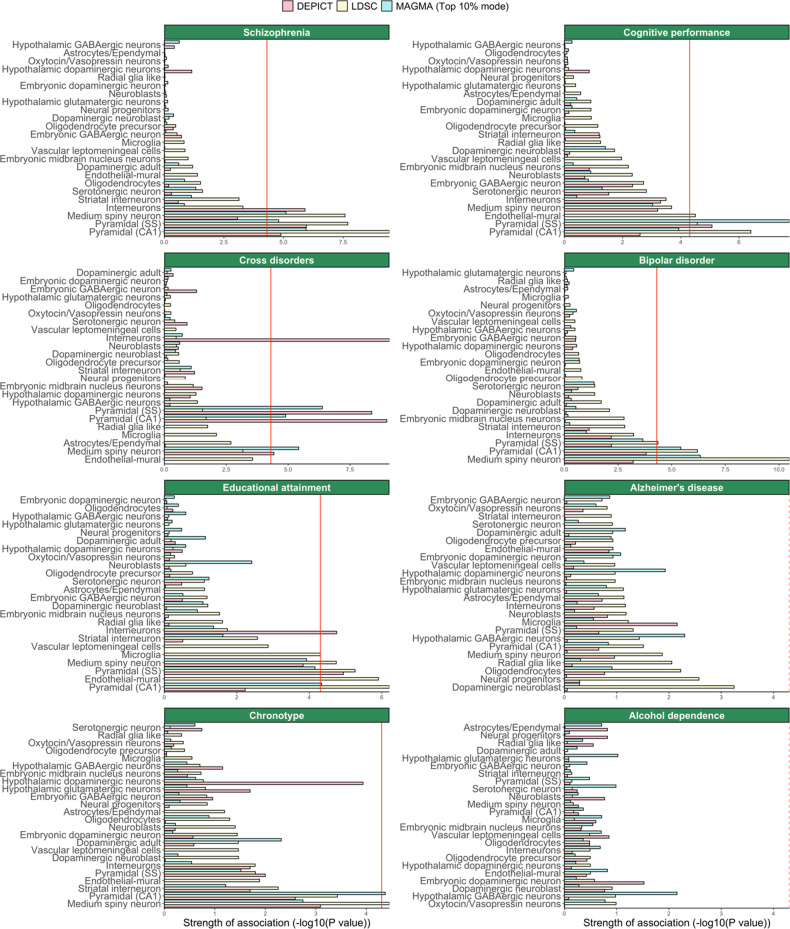
Fig. 2. Cell type enrichment estimated by DEPICT, LDSC, and MAGMA top 10% mode in selected brain-related phenotypes.
Cell type enrichment results are generated using KI data. Bars represent the mean strength of association (-log10(P)) of LDSC, DEPICT, and MAGMA top 10% mode. The red line indicates the Bonferroni threshold P < 0.05/(24*42). The red line is solid if any of the methods identified any cell type as significantly associated, and if none of the methods identified any of the cell types as significantly associated, the red line is dashed. A complete overview of cell type enrichment results using KI data, including MAGMA linear mode is available in the supplementary information (Fig. S18).

