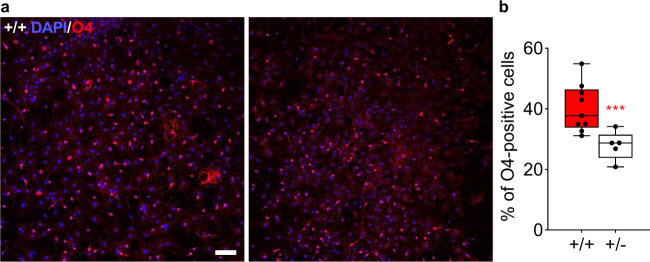
Fig. 4. Effect of Tbx1 heterozygosity on oligodendrocytes.
Representative images (a) and box-and-whisker plots (b) of O4-positive (red) oligodendrocytes among all DAPI-positive (blue) cells in culture are shown. Since the assumption of normality was not met (Shapiro–Wilk tests: +/+, W(35) = 0.888, p = 0.002; +/−, W(19) = 0.898, p = 0.045), we applied a generalized linear mixed model of log-transformed data. Progenitor cells derived from the lateral ventricular walls of P21 Tbx1 +/− mice produced consistently fewer O4-positive oligodendrocytes than those of +/+ mice across the cultures (Genotype, F(1,11.451) = 12.841. p = 0.004, *** Image field, F(3, 33.978) = 0.609, p = 0.614; Genotype x Image field, F(3,33.978) = 0.134, p = 0.939). Scale bar = 200 μm. +/+, n = 9; +/−, n = 5.

