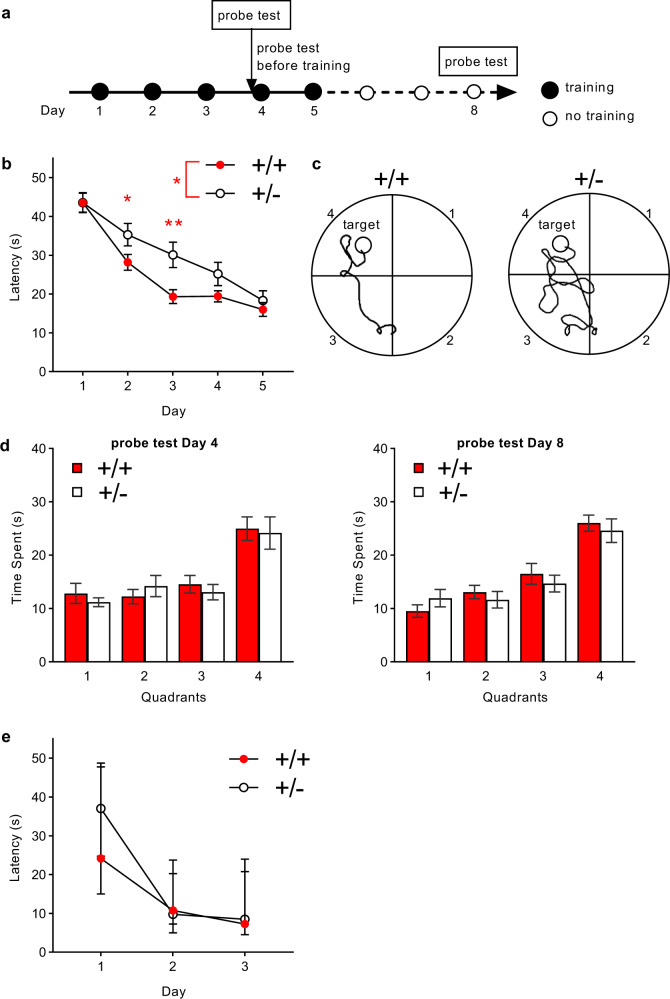
Fig. 5. Performance in the Morris water maze test.
a Experimental design. b The mean (± standard error of the mean [SEM]) escape latency in seconds (s) to the platform during acquisition is plotted against days. Compared with +/+ mice, +/− mice exhibited delayed acquisition (Genotype, F(1,26) = 4.643, p = 0.041, ∗[; Day, F(4,104) = 55.490, p < 0.001; Genotype × Day, F(4,104) = 2.329, p = 0.061). The overall genotype effect was primarily due to robust differences on Day 2 (*, p < 0.05) and Day 3 (**, p < 0.01), as determined by Newman–Keuls post hoc tests. +/+, n = 14; +/–, n = 14. c Representative swim paths of a +/+ mouse and +/− mouse on the third training day. The target quadrant included the hidden platform. d The mean (± SEM) time spent during recall probe tests before training on Day 4 (left) and Day 8 (right). Regardless of the quadrant, there were between-genotype differences on Day 4 (Genotype, F(1,26) = 5.597, p = 0.026; Quadrant, F(3,78) = 14.259, p < 0.001; Genotype × Quadrant, F(3,78) = 0.295, p = 0.829) and Day 8 (Genotype, F(1,26) = 10.207, p = 0.004; Quadrant, F(3,78) = 24.031, p < 0.001; Genotype × Quadrant, F(3,78) = 0.562, p = 0.642). The significant main effects of genotype on both days primarily resulted from the generally lower amounts of time spent in three out of the four quadrants in +/− mice (Day 4, Quadrants 1, 3, and 4; Day 8, Quadrants 2, 3, and 4). e The mean (± SEM) escape latency in the visible cue task. A separate set of mice underwent examination using this version of the Morris water maze. +/+ and +/− mice equally acquired this task (Genotype, F(1,17) = 1.861, p = 0.190; Day, F(2,34) = 52.313, p < 0.001; Genotype × Day, F(2,34) = 1.229, p = 0.305). +/+, n = 8; +/−, n = 11.

