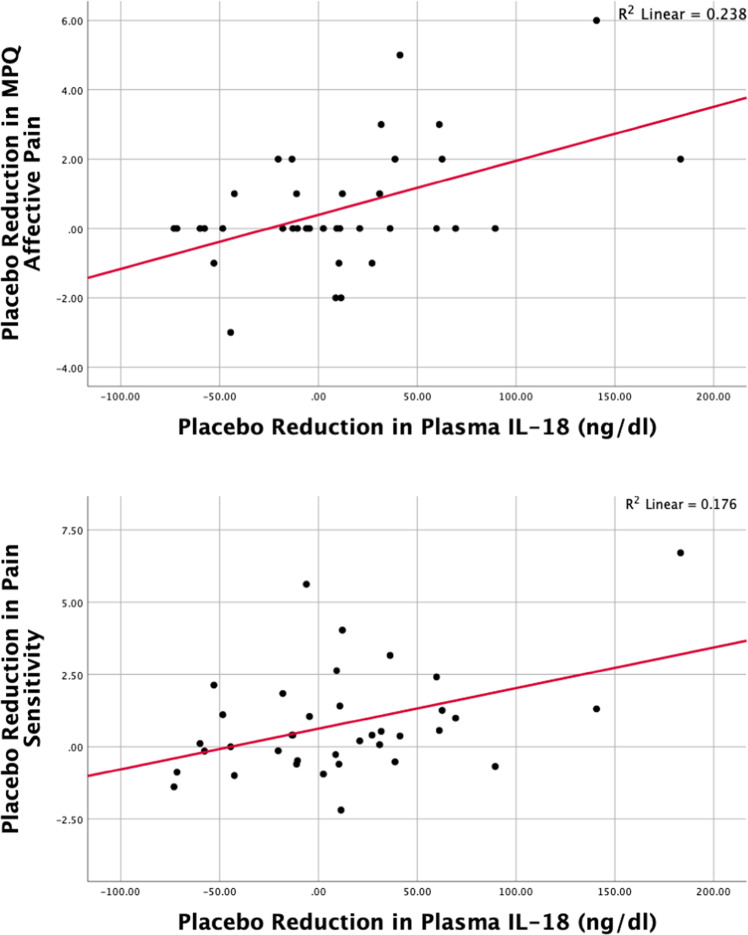
Fig. 4. Relationships between placebo-induced changes in MPQ affective pain (top graph) and pain sensitivity scores (bottom graph) with placebo induced changes in plasma IL-18 are depicted in this graph.
The sample derived from n = 37 healthy volunteers (12 males, 25 females). (Note: correlation testing with placebo-induced changes in MPQ Sensory Pain score was not completed given the lack of significance in testing of correlations between MPQ Sensory Pain and pain induced change in plasma IL-18). The top graph shows the correlation between placebo-induced reductions in MPQ Affective pain scores and placebo-induced changes in IL-18 plasma levels during the pain challenge (r = −0.49, p = 0.001). The bottom graph shows similar relationships for placebo induced changes in Pain Sensitivity and IL-18 during pain (r = −0.42, p < 0.005).

