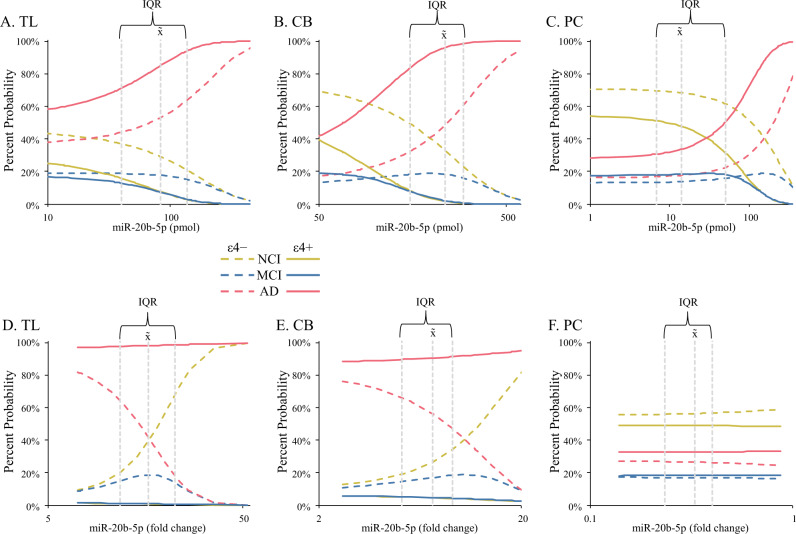
Fig. 1. Levels of miR-20b by quantitative real-time PCR (qRT-PCR) in brain autopsy samples alter probability of NCI, MCI, and AD.
miR-20b was quantified in temporal lobe (TL), cerebellum (CB), and posterior cingulate cortex (PCC) samples as described in the main text. Effect of miR-20b levels on probability of diagnosis (NCI/MCI/AD) was then modeled. A–C Comparison of absolute quantitation by diagnosis and brain region. D–F Comparison of ΔΔCT (fold change) quantitation by diagnosis and brain region. Symbols indicate estimated marginal means categories. IQR: Interquartile range for miR-20b within a brain region. x̃: Median of miR-20b within a brain region. Significant effects are indicated by line colors and patterns, to wit: NCI, APOE ε4 absent:  ; NCI, ε4 present:
  ; MCI, ε4 absent:
  ; MCI, ε4 present:
  ; AD, ε4 absent:
  ; AD, ε4 present:
 . Finally, miR-20b-5p axes for all charts is log scale.

