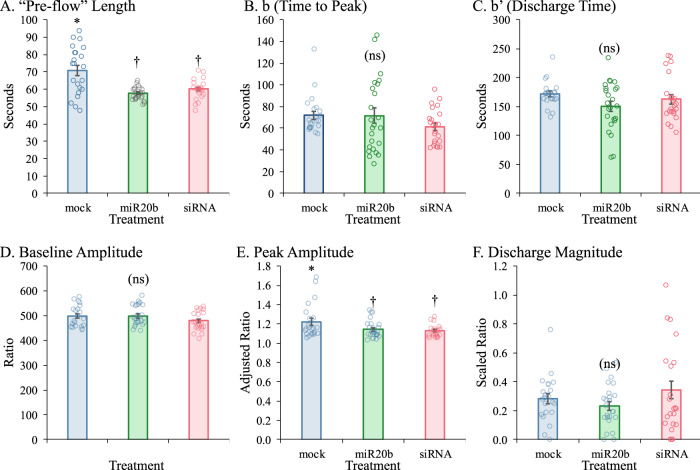
Fig. 6. Effects of miR-20b treatment on calcium efflux.
Outcomes for different measures were calculated as described in main text. A “Pre-flow” length, indicating time between injection and first response. B Time to peak (cycles) starting at point “0”. C Discharge time (between peak and “II”). D Baseline (“0” to “I”) amplitude. E Peak amplitude. F Discharge magnitude. Symbols indicate statistical groups of response over entire curve. Treatments sharing the same symbol did not significantly differ. Error bars represent standard errors of means (SEM). Lack of any pairwise significant differences indicated by “(ns)”.

