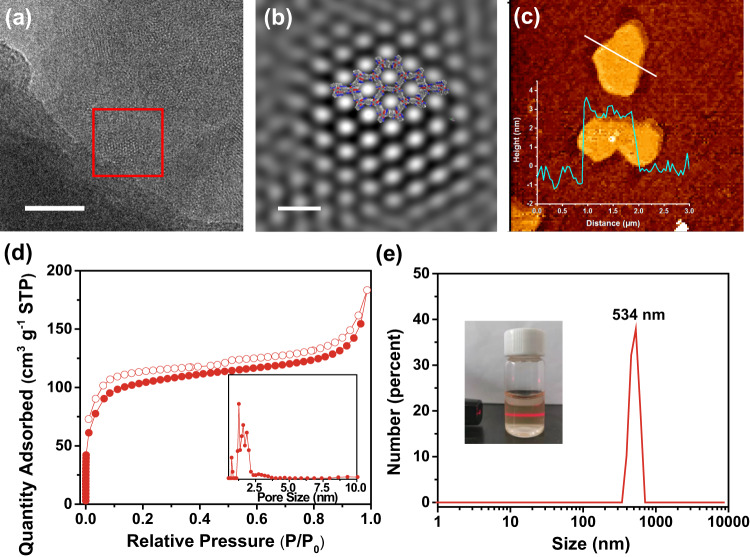
Fig. 2. Characterizations of CYANO-CON (obtained by ball milling of CYANO-COF).
a HRTEM image (scale bar, 50 nm), and b Fourier-filtered image of a selected red square area (scale bar, 5 nm). c AFM image (inset: height plot). d Nitrogen sorption isotherms at 77 K and pore size distribution (inset). e Particle size distribution by dynamic light scattering (inset: photograph of colloid solution after 4 months and observed Tyndall effect).

