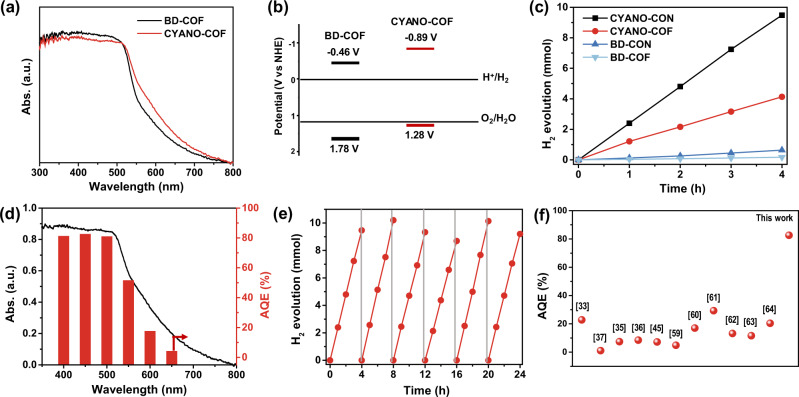
Fig. 3. Absorption spectra, band positions and photocatalytic H2 evolution.
a UV-vis DRS spectra of BD-COF and CYANO-COF. b Schematic energy band structures of BD-COF and CYANO-COF. c Time course of photocatalytic H2 production for different COFs and CONs (20 mg catalyst in 100 mL water, 1 wt% Pt, 10 mmol ascorbic acid, λ > 420 nm). d Wavelength-dependent AQE of photocatalytic H2 production for CYANO-CON. e Cycling stability for CYANO-CON in photocatalytic H2 production. f AQE of HER for state-of-the-art representative COFs and conjugated polymers.

