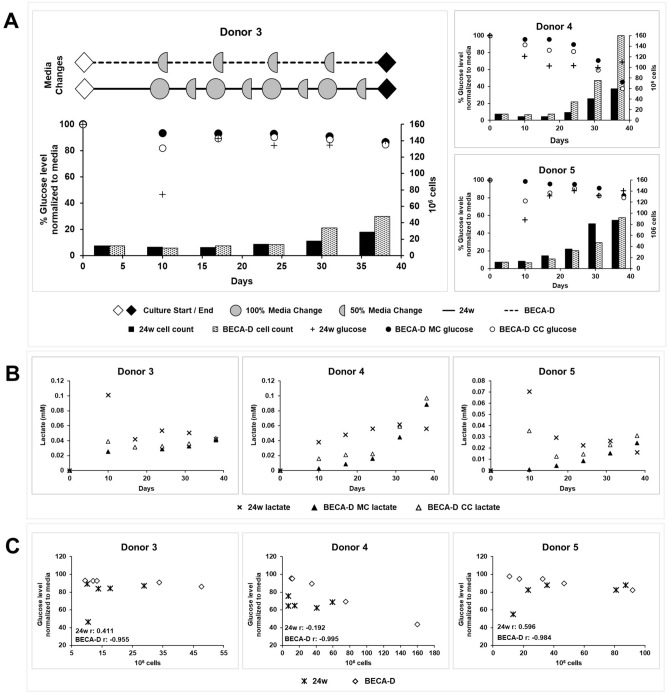
Figure 4.
Glucose and lactate levels in 24-well plate (24w) and BECA-D during EBVST culture. (A) Normalized glucose level (markers) in media collected and cell count (bar graph) in 24-well plate (24w) and BECA-D at the end of each activation. MC media chamber, CC cell chamber. Representative media change frequencies in 24-well plate and BECA-D are shown in Donor 3 graph. (B) Lactate concentration in media collected in 24-well plate (24w) and BECA-D at the end of each activation. (C) Plot of cell count against matched normalized glucose level in 24-well plate (24w) and BECA-D starting from 2nd activation, r value was calculated using Pearson correlation coefficient.

