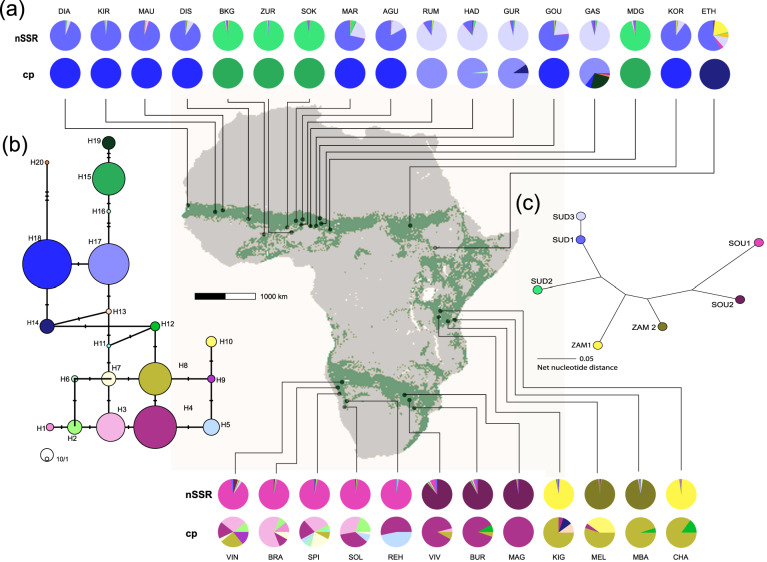
Figure 1.
(a) The Geographic occurrence of populations of Senegalia senegal analyzed, showing the proportional assignment to both, seven gene pools of nSSR and cpDNA haplotypes. Each pie chart represents one population and the colors within the pie chart depict the distinctive haplotypes/gene pools. (b) Median‐joining network of the 20 cpDNA haplotypes (H1-H20). Circle sizes are proportional to haplotype frequencies. Small bars indicate the number of mutational steps in case more than one step occurred. (c) Neighbor-joining tree showing the relationship among seven nSSR gene pools (K = 7) as revealed by STRUCTURE (Fig. 2). The map was downloaded from WORLDCLIM41 and modified manually. The green area in the map background indicates the modeled potential distribution of S. senegal27 generated using ArcGIS Desktop ver. 10.542. See Supplementary Table S1 for population details.

