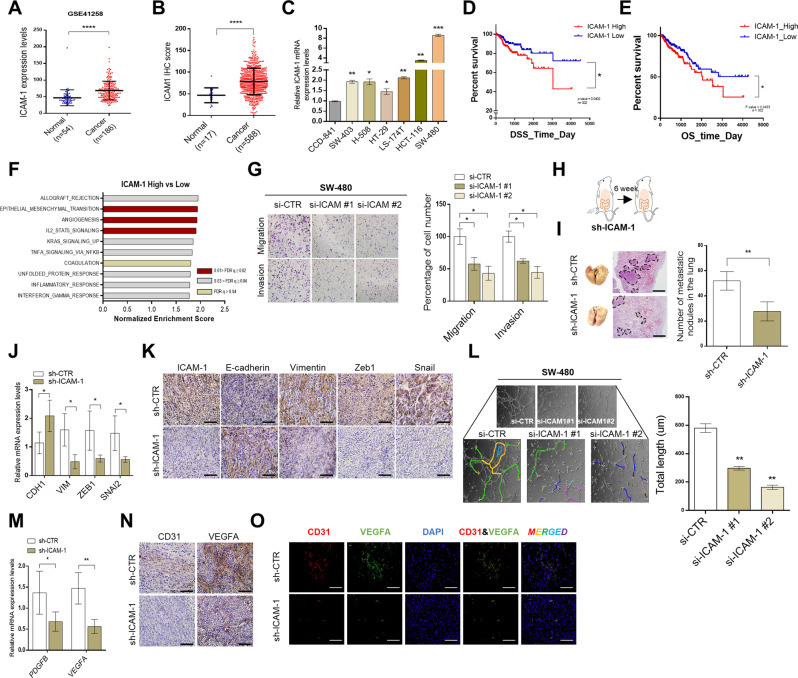
Fig. 1. ICAM-1 promotes poor prognosis by regulating EMT and angiogenesis in colorectal cancer.
A ICAM-1 expression data in normal colon tissue (n = 54) and colorectal cancer tissue (n = 186) was obtained from the Gene Expression Omnibus (GEO) database. B Tissue microarray analysis of ICAM-1 expression in normal (n = 17) and cancer (n = 588) type of colorectal tissues. C qRT-PCR was performed to detect the expression of ICAM-1 in various colorectal cancer cell lines and normal colon cell. D, E Kaplan–Meier survival analysis cohorts based on low and high expression of ICAM-1 in colorectal cancer. (TCGA, n = 302). F GSEA (GSE4183) analysis was performed in colorectal cancer that ICAM-1 high expressed for hallmarks of cancer progression. NES normalized enrichment score; FDR q val false discovery rate q-value. G Transwell chamber assays were performed to determine whether expression of ICAM-1 modulates EMT after silencing ICAM-1 using SW-480 cells. H SW-480 cells transfected with sh-CTR and sh-ICAM-1 (3 × 10⁶) were injected into the cecal wall of athymic BALB/c-nude (8-weeks old) mice (n = 4). I Representative H&E staining images of lung metastases. And the graph shows the number of lung metastatic lesions in each mouse. J, K qRT-PCR and IHC staining of expression levels for EMT markers and regulators in tumor tissues of sh-CTR and sh-ICAM-1 injected mice. L Tube-forming ability of HUVEC cells was performed by incubation with SW-480 in which ICAM-1 was silenced. Tube formation was assessed after 2 h using light microscopy, and the Image J program was used to analyze tube length. M, N qRT-PCR and IHC staining of expression levels for that angiogenesis-related markers and growth factors in tumor tissues of sh-Ctr and sh-ICAM-1 injected mice. O Representative immunofluorescence image for CD31 (red) and VEGFA (green) in mouse tumors. Scale bar, 100 μm, β-actin and positive control were used as a control for normalization. Data are presented as mean ± SD and analyzed by Student’s t-tests. *P < 0.05; **P < 0.01; ***P < 0.001.

