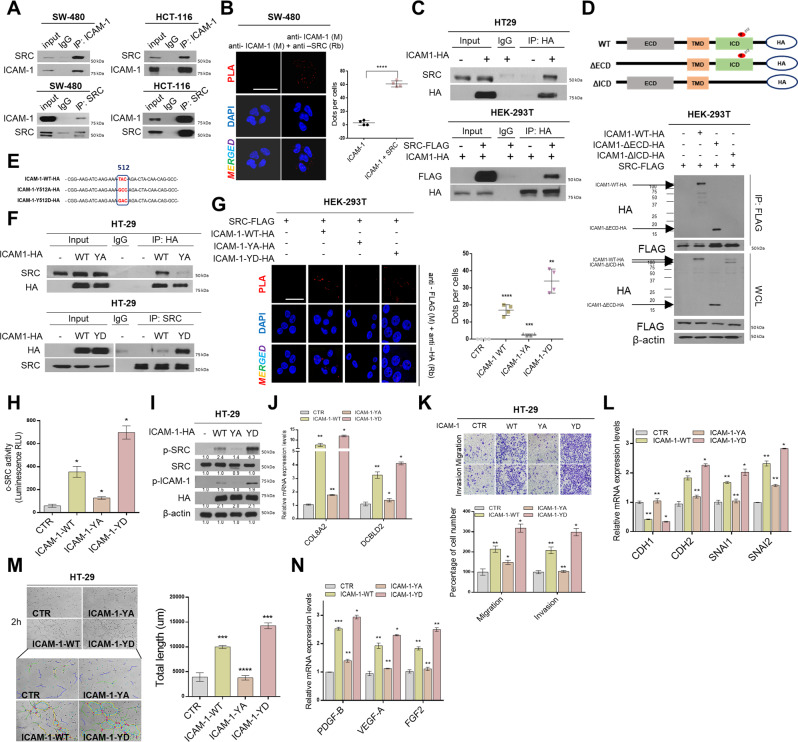
Fig. 3. The Tyr512 residue of ICAM-1 serves as an important cofactor in SRC signaling activity.
A Co-IP was performed. The cell lysate was immunoprecipitated with an ICAM-1 and SRC antibody or an immunoglobulin G (lgG) to detect the protein interaction between ICAM-1 and SRC in SW-480 and HCT-116 cells. B Representative confocal images of in situ PLA staining in SW-480 cells using anti-ICAM-1 (M) and anti-SRC (Rb). The graph shows the number of dots per cell counted using ImageJ software. Scale bar = 100 μm. C Co-IP analysis shows protein interaction of ICAM-1 with SRC using transfected HT-29 and HEK293T cells. D Co-IP assay is showed that SRC binds to the intracellular domain of ICAM-1. HEK293T cells were co-transfected with expression plasmids encoding FLAG–SRC and deletion construct of HA-ICAM-1. E Schematic diagram of the point mutation of Tyr residue in ICAM-1. F Co-IP experiment between SRC and point mutation structure of ICAM-1. HEK293T cells were co-transfected with expression plasmids encoding FLAG–SRC and point mutation construct of HA-ICAM-1. WT, wild-type ICAM-1; YA, ICAM-1 Y512A mutant (inactivation form); YD, ICAM-1 Y512D (activation form). G Representative confocal images of in situ PLA staining in HEK293T cells using anti-FLAG (M) and anti-HA (Rb). The graph shows the number of dots per cell counted using ImageJ software. Scale bar = 100 μm. H, I p-SRC activity was detected using Src kinase assay and Western blot in HT-29 cells transfected with various ICAM-1 point mutation constructs. J qRT-PCR of representative SRC signature genes was performed in HT-29 cells. K Migration/Invasion assays of ICAM-1 point mutation constructs in HT-29 cells. L qRT-PCR for marker and transcription factor of EMT were performed. M Tube formation assay of ICAM-1 point mutation constructs in HT-29 cells. Tube formation was assessed after 2 h using light microscopy, and the Image J program was used to analyze tube length. N qRT-PCR for angiogenic factors were performed. β-actin and positive control were used as a control for normalization. Data are presented as mean ± SD and analyzed by Student’s t-tests. *P < 0.05; **P < 0.01; ***P < 0.001.

