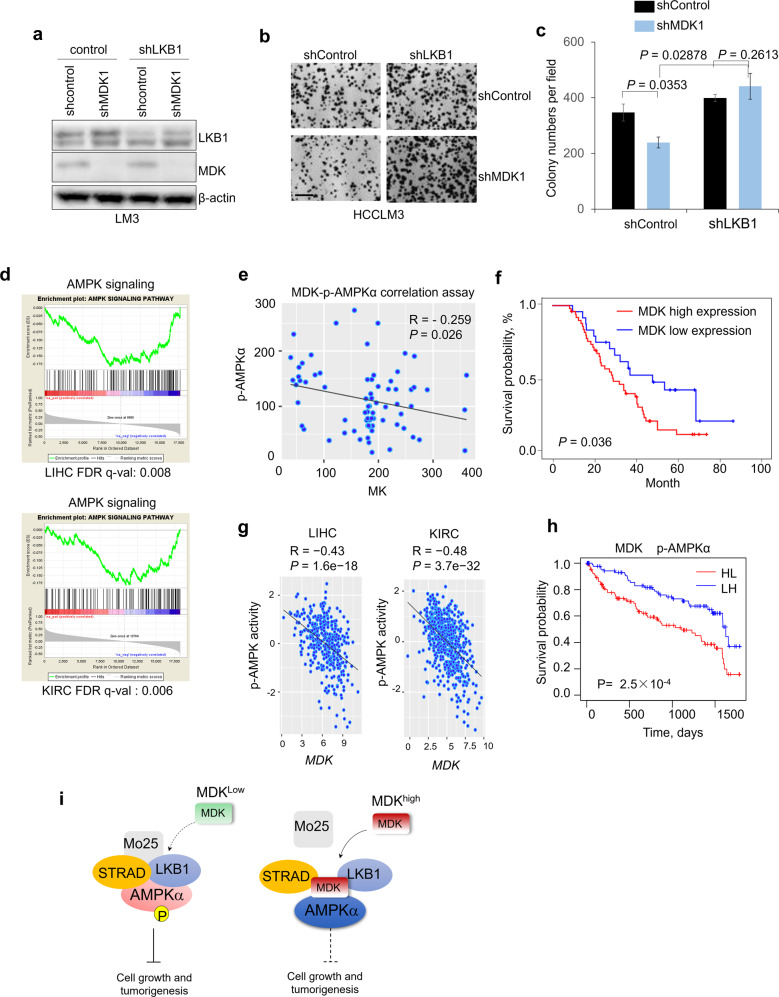
Fig. 7. Midkine promotes cancer progression by negatively regulating AMPK signaling.
a Western blotting of MDK, LKB1 and β-actin from HCCLM3 cells transduced with LKB1 shRNA or in combination with MDK shRNA. b–c Colony-forming assay of the HCCLM3 cells transduced with LKB1 shRNA or in combination with MDK shRNA. Images (b) and quantification (c) of colony formation. n = 3 wells per group. Scale bar, 200 μm. d GSEA results showing the negative correlations between MDK and the AMPK signaling pathway based on the TCGA LIHC and KIRC cohorts. Genes in the RNA-seq data were ranked by the Pearson coefficients of the correlations between the genes and MDK, and the ranked gene list was utilized as the input for the GSEA software program. e–f Scatter plots showing the inverse correlation of MDK with p-AMPKα expression and MDK expression in human hepatocellular carcinoma tumors (e), Kaplan–Meier survival curves of HCC patients with data stratified by MDK expression levels (f) (n = 74). g Scatter plots showing the inverse correlation of MDK AMPK activity in the TCGA LIHC and KIRC cohorts (LIHC n = 371, KIRC n = 531). Gene expression was obtained from RNA-seq data from the TCGA. AMPK activity was estimated by the expression of their downstream target genes. Statistical significance in (e-g) was determined by Pearson correlation test. R: Pearson correlation coefficient. R, Spearman rank correlation coefficient. h Kaplan–Meier survival curves of the TCGA KIRC patients with data stratified by the expression of MDK and the activity of AMPK. HL: MDK is high, AMPK activity is low; LH: MDK is low, AMPK activity is high. Median expression/activity levels were utilized as the thresholds for high and low separation. i. Schematic illustration of the MDK mechanisms of action: high MDK expression depolymerizes the LKB1-STRAD-Mo25 complex and subsequently suppresses the activity of AMPK signaling in human cancers.

