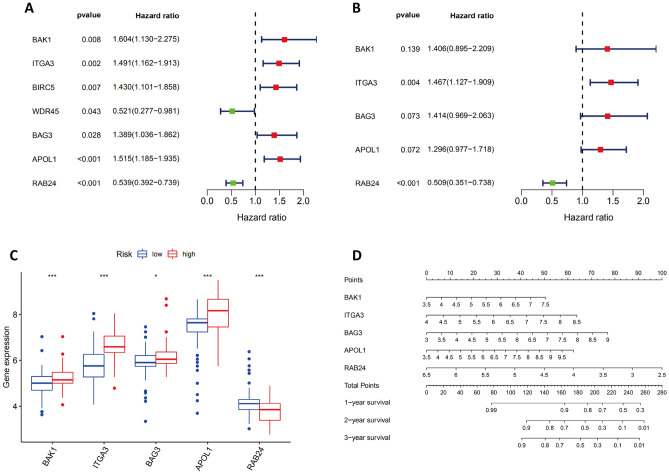
Figure 3.
Establishment of a Prognostic Signature with 5 ARGs. Cox regression analyses of the ARG hazard ratios (HRs) in PAAD according to univariate (A) and multivariate (B) analyses. Red boxes indicate higher-risk ARGs with HRs > 1; green boxes indicate lower-risk ARGs with HRs < 1. (C) The levels of the 5 ARGs in the low/ high-risk groups. (D) A nomogram was generated to predict the survival rates of pancreatic cancer patients after one, two, and three years of therapy. A symbol of *, **, or *** denotes a p < 0.05, p < 0.01, or p < 0.001, respectively.

