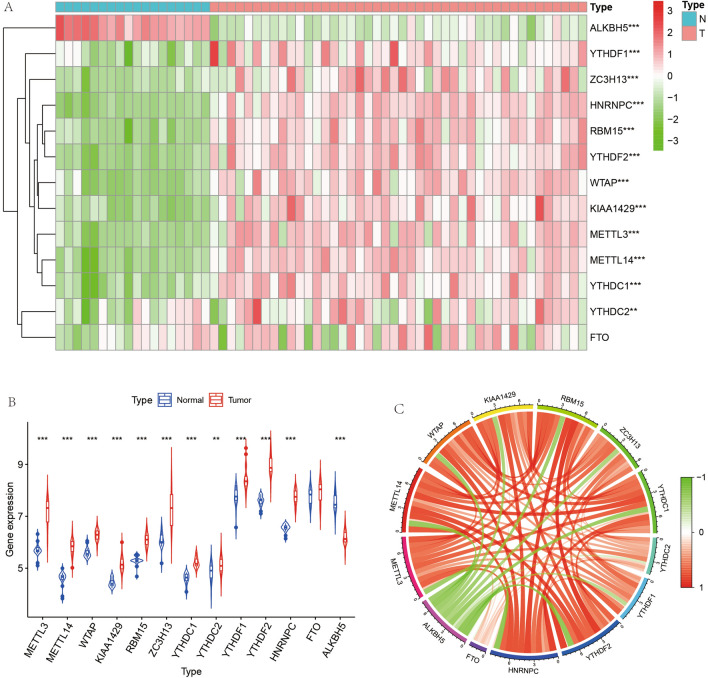
Figure 3.
Heat map, violin map and correlation circle map of m6A-related genes. (A) shows a heat map of differential expression of m6A-related genes, with red indicating highly expressed genes and green indicating lowly expressed genes. (B) represents the expression of m6A-related genes in paraneoplastic tissues and in Ewing's sarcoma. Figure C represents the correlation plot between m6A-related genes, with the linkage between quantitative genes in red for synergistic high expression and in green for synergistic low expression.

