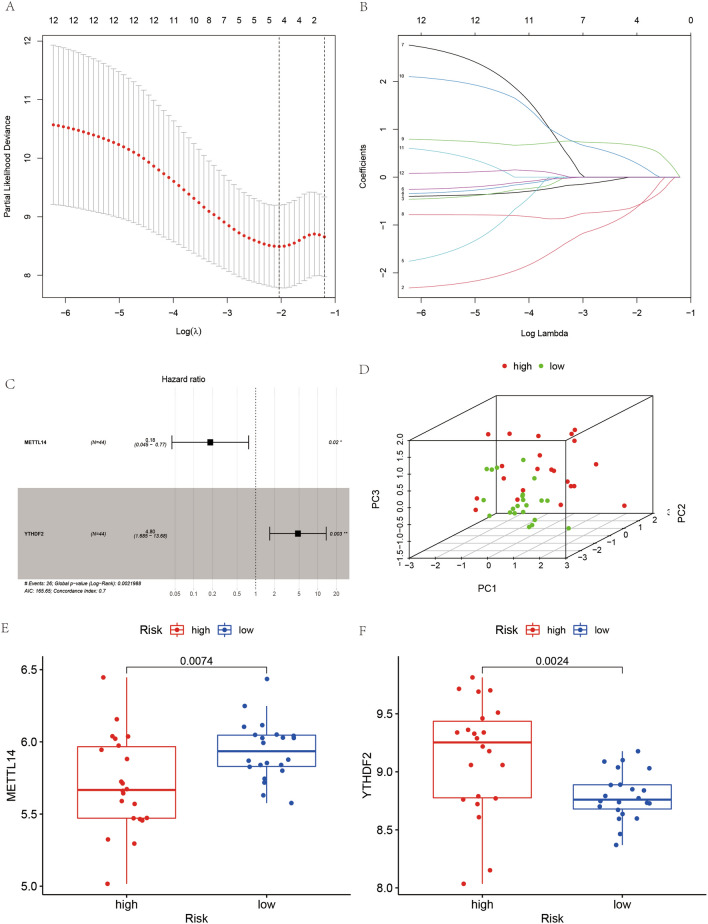
Figure 5.
Diagram of the construction process of the prognostic model. (A) and (B) represent the results of the LASSO regression analysis. (C) represents a plot of the results of the multivariate COX regression analysis. (D) shows the 3D-principal component analysis plot, with red points indicating high-risk cases and green points indicating low-risk cases. (E) and (F) indicate the expression of METTL14 and YTHDF2 in the high-risk group and in the low-risk group, respectively.

