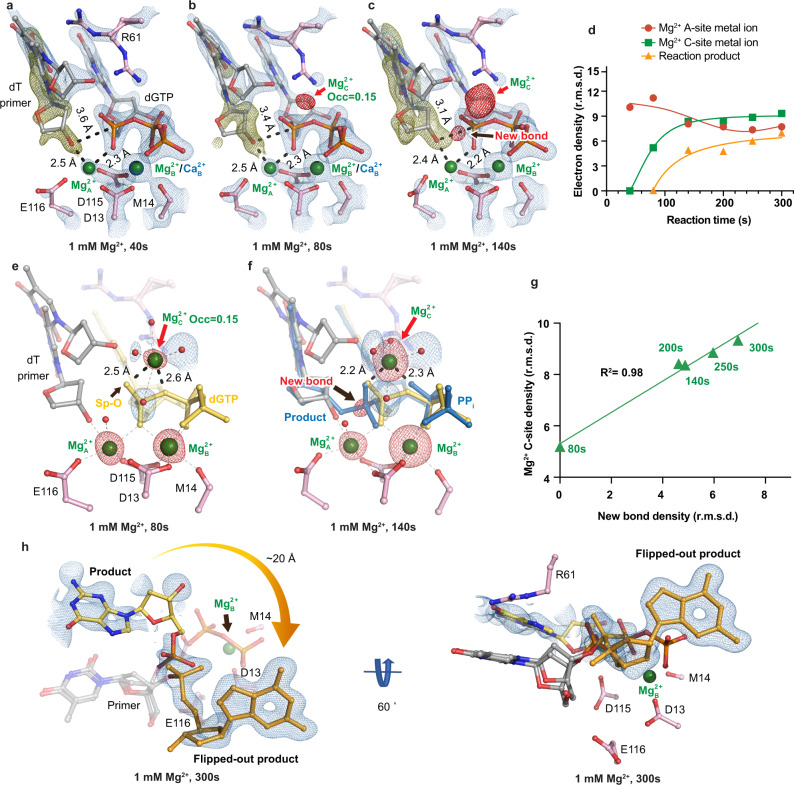
Fig. 2. In crystallo visualization of Pol η misincorporation with Mg2+.
a–c Structures of Pol η during in crystallo catalysis after 1 mM Mg2+ soaking for 40 s (a), 80 s (b), and 140 s (c). The 2Fo-Fc map for the primer up conformation (blue) was contoured at 1.2 σ. The 2Fo-Fc map for the Me2+A, Me2+B, dGTP, and catalytic residues (blue) was contoured at 2 σ in (a–c). The Fo-Fc omit map for the down conformation of the primer (green) was contoured at 3.3 σ in (a–c). The Fo-Fc omit map for all the Mg2+C, and newly formed bond (red) was contoured at 4 σ. d Timescale of Mg2+A, Mg2+C binding and reaction product in crystallo with Mg2+. e, f Observation of the Mg2+C after 1 mM Mg2+ soaking for 80 s (e) and 140 s (f). g Correlation (R2) between the newly formed bond and the Mg2+C binding. d, g The data points represent singular measurements for r.m.s. density values of electron density. In (e, f), the 2Fo-Fc map for the water molecules that were coordinated by the Mg2+C was contoured at 0.7 σ. The Fo-Fc omit map for the Mg2+C, new bond, and Mg2+A and Mg2+B was contoured at 4 σ. h Alternative product state of Pol η in crystallo with 1 mM Mg2+ at 300 s. The 2Fo-Fc map was contoured at 1 σ.

