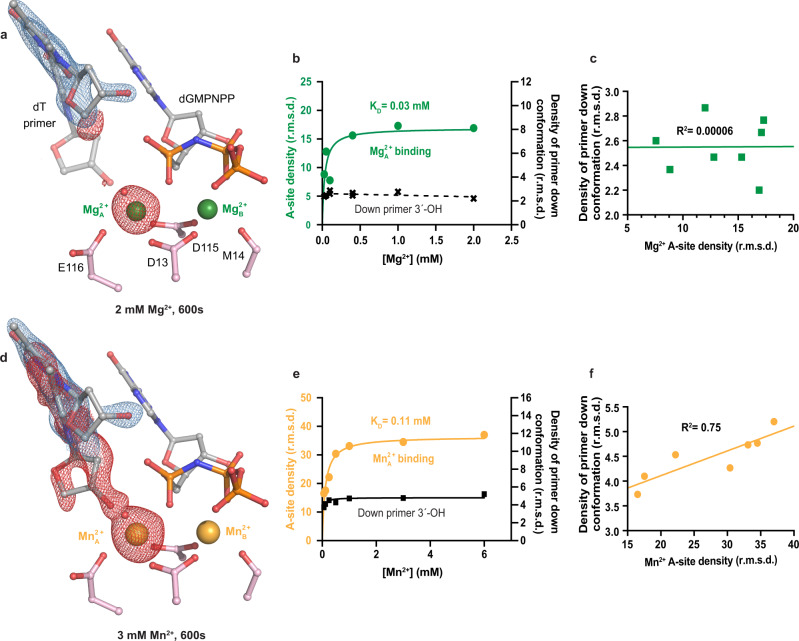
Fig. 5. Titration of the Me2+A on primer 3′-OH alignment.
a Structure of Pol η:dGMPNPP with 2.0 mM Mg2+. b Plot showing Mg2+A density and omit map electron density for the down primer with Mg2+ concentration. c Correlation (R2) between the Mg2+A density and omit map electron density for the down primer. d Structure of Pol η:dGMPNPP with 3.0 mM Mn2+. e Plot showing Mn2+A density and omit map electron density for the down primer with Mn2+ concentration. f Correlation (R2) between the Mn2+A density and omit map electron density for the down primer conformation. The 2Fo-Fc map for the primer up conformation (blue) was contoured at 2 σ in (a) and 1.5 σ in (d). The Fo-Fc omit map for both the Me2+A and primer down conformation (red) were contoured at 3 σ. All data points shown in the plot were collected at t = 600 s and represent singular measurements.

