Fig. 7.
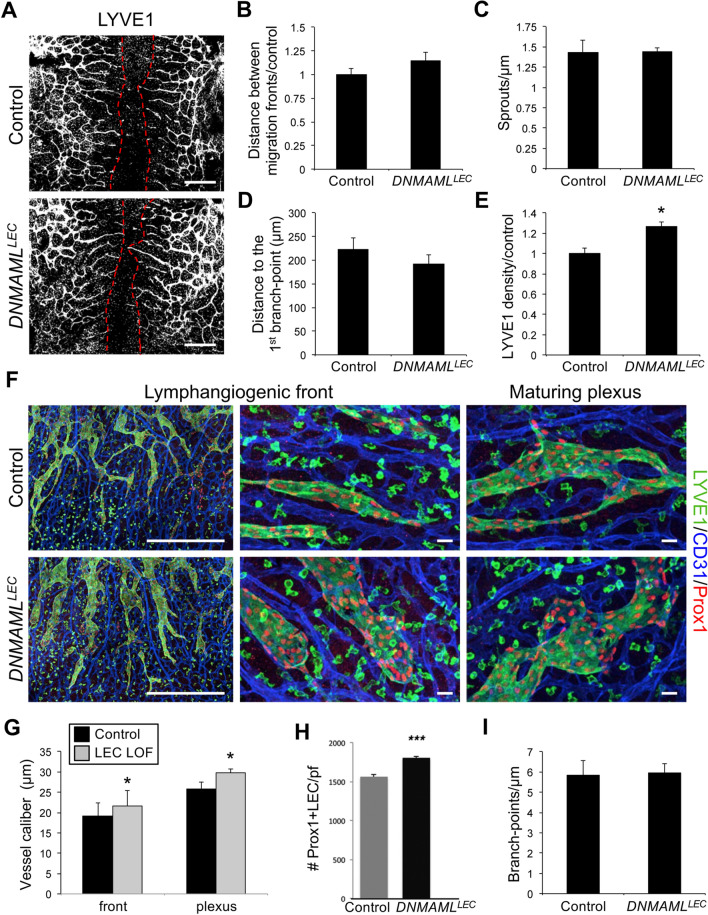
Loss of canonical Notch signaling in LECs increased dermal lymphatic density. Prox1CreERT2 and DNMAMLfl/fl mice were crossed, tamoxifen administered at E12.5 and dorsal dermis analyzed at E14.5. a Representative images of LYVE1 staining of Prox1CreERT2;DNMAMLfl/+ (DNMAMLLEC) and DNMAMLfl/+ (control) dermis. Red dotted line marks leading edge of lymphatic fronts. Scale bars, 1000 μm. b Quantification of the distance between migration fronts, normalized to the DNMAMLfl/ + controls. Data presented ± s.e.m. Control (n = 7), DNMAMLLEC (n = 9). c Quantification of the number of lymphangiogenic sprouts normalized by length of the front. Data presented ± s.e.m. Control (n = 8), DNMAMLLEC (n = 6). d Quantification of the distance between migration fronts, normalized to the DNMAMLfl/ + controls. Data presented ± s.e.m. Control (n = 8), DNMAMLLEC (n = 6). e Quantification of average LYVE1+ vessel density normalized by area. Data presented relative to control ± s.e.m. t test *p < 0.002, control (n = 7), DNMAMLLEC (n = 9). f LYVE1, CD31, and PROX1 staining of DNMAMLLEC mutant and control dermal wholemounts. Images represent low (left) and high (middle) magnification of the lymphangiogenic front and the maturing plexus (right). Scale bars, 500 μm (left), 100 μm (middle, right). g Quantification of the average vessel caliber at the lymphangiogenic front and in the maturing plexus. Data presented ± s.e.m. t test: *p < 0.04, **p < 0.01, Control (n = 8), DNMAMLLEC (n = 6). h Quantification of the number of PROX1+/LYVE1+ LECs per field (pf). Data presented as ± s.d. ***p < 0.001. Control (n = 8), DNMAMLLEC (n = 6). i) Quantification of the average number of branch-points normalized to unit of vessel length. Data presented ± s.e.m. control (n = 3), DNMAMLLEC (n = 5)

