Fig. 5.
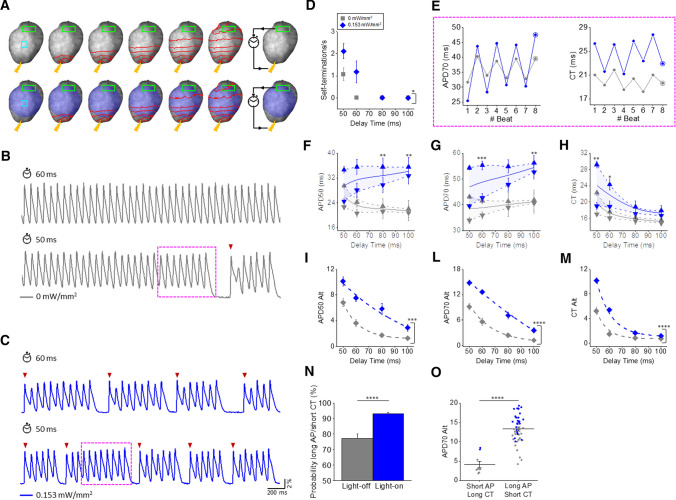
Sub-threshold illumination in ChR2 intact mouse hearts during electrically stimulated VT. A Scheme showing electrically stimulated VT in intact mouse heart expressing ChR2 in the presence (bottom) and absence (top) of sub-threshold illumination of the whole heart with LI = 0.153 mW/mm2. An electrical pulse (yellow bolt symbol) was applied to the apex of the ventricle to induce an AP which propagated towards the base of the heart (red dashed lines). Once the propagating wave was optically detected in the user-defined ROI (green rectangle), the system reinjects the electrical stimulus at the apex of the heart with a pre-defined fixed DT (clock). B, C Fluorescent signals (ΔF/F) extracted from the cyan ROIs showing VTs stimulated with a DT of 60 ms and 50 ms in the absence (traces in gray) and presence (traces in blue) of sub-threshold illumination. Spontaneous APs (red arrowhead) detected in the green ROI in A are needed to start or re-start the re-entrant cycle. D Number of interruptions per second of VT as a function of the DT, measured under light-off (LI = 0 mW/mm2, in gray) and light-on (LI = 0.153 mW/mm2, in blue) conditions. E) APD70 (left) and CT (right) oscillations in VTs showed in B and C (dotted magenta frame). The last beat before VT block has a long AP and a short CT. F–H APD50, APD70 and CT during odd (downward pointing triangles) and even (upward pointing triangles) beats. APD50, APD70 and CT mid-values are also shown (solid line) by averaging the even and odd beats. I-M) APD50, APD70 and CT alternans magnitude (Alt) measured under light-off and light-on conditions. A linear or an exponential fit was superimposed on experimental data. N) Probability that the last beat before VT block displays both a long AP and short CT calculated under light-off and light-on conditions. O APD70 Alt in several VT terminations measured under light-off and light-on conditions as a function of the last beat before VT termination with a short AP/long CT or a long AP/short AP. Data were collected from eight ChR2 hearts. Data are reported as mean ± SEM. Two-way ANOVA with Tukey test means comparison (F–M) and Student’s t test (N, O) were applied

