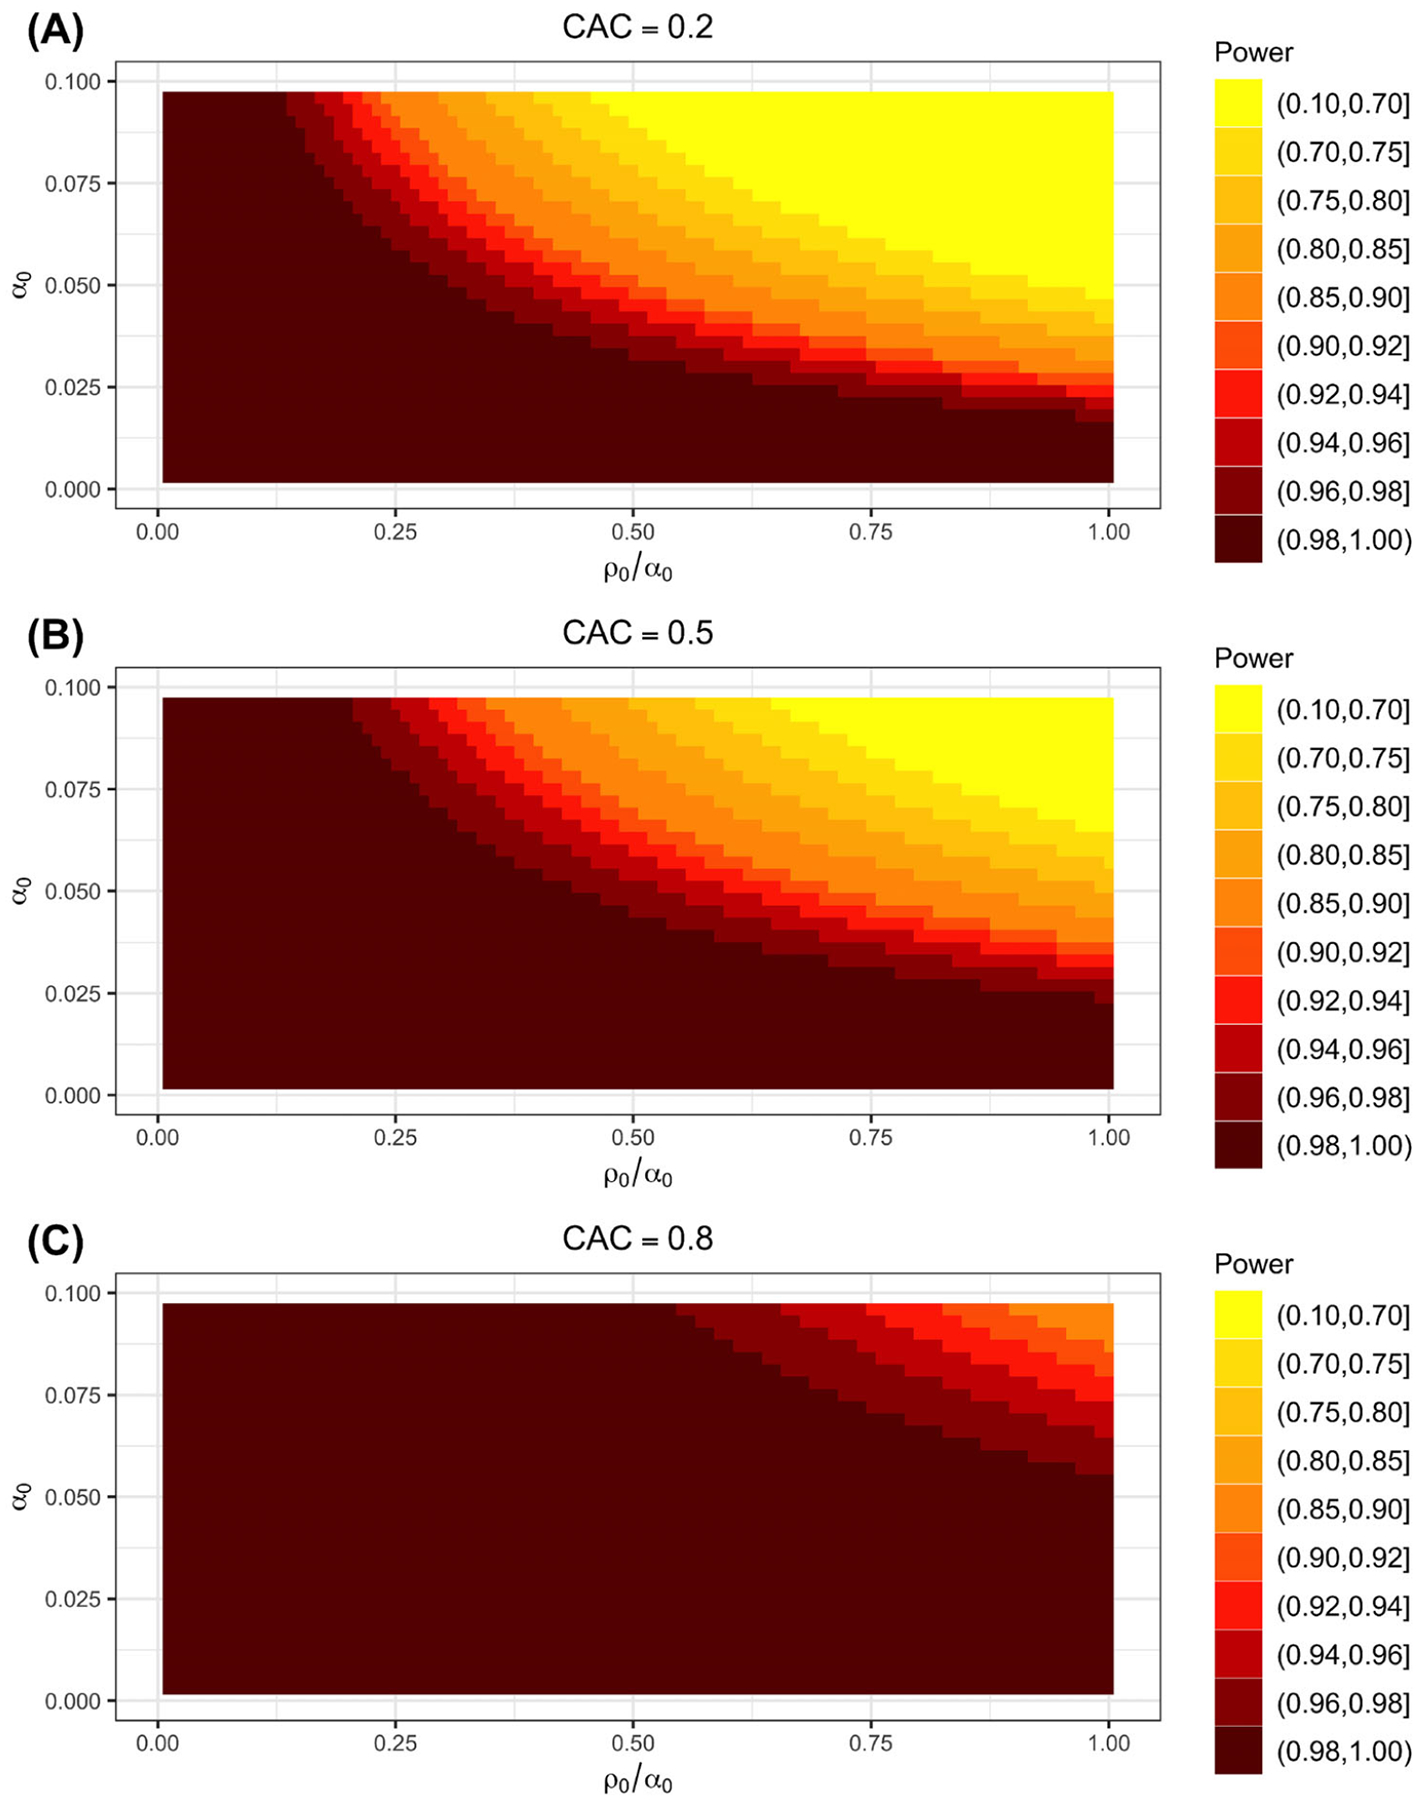
FIGURE 3.

Contour plots illustrating the relationship between ICCs and power in our application study of the LIRE trial. ICCs include: within-period within-subcluster α0; between-period within-subcluster α1; within-period between-subcluster ρ0; and between-period between-subcluster ρ1. Various α0 specifications are shown on the y-axis and various ρ0 specifications are shown on the x-axis as a ratio of α0. Between-period specifications are denoted by the CAC. Darker colors correspond to higher values of power
