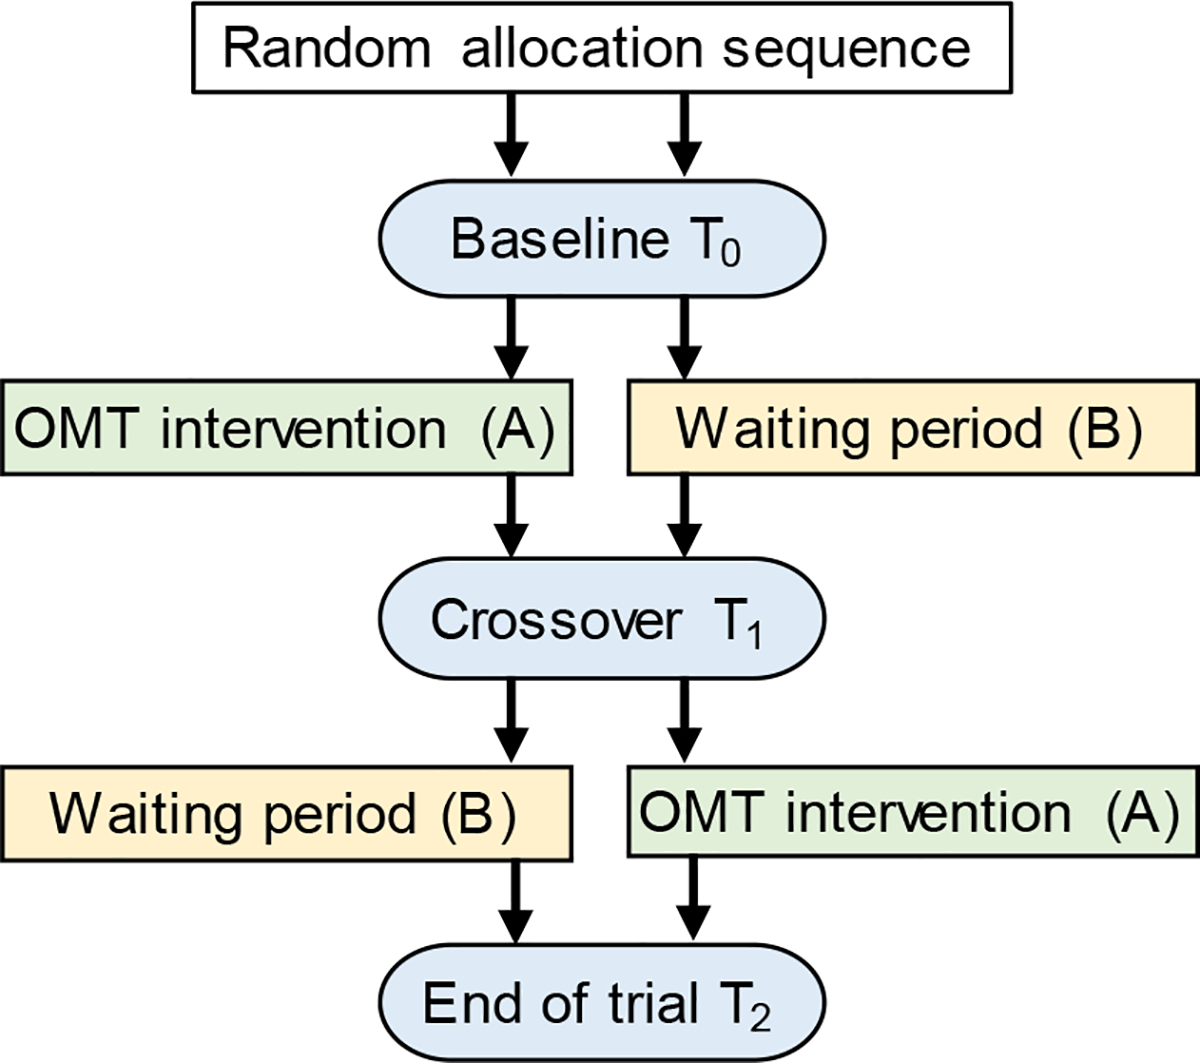
Figure 1.

Schematic of the randomized, cross-over, controlled trial design. Subjects in the AB arm received treatment (A – OMT intervention) followed by no treatment (B - waiting period); whereas subjects in the BA arm received no treatment (B - waiting period) followed by treatment (A – OMT intervention). Patient-reported outcomes were collected at baseline (T0), cross-over point (T1), and end of the trial (T2). These three time points were spaced approximately 4–6 weeks.
