
Figure 2.
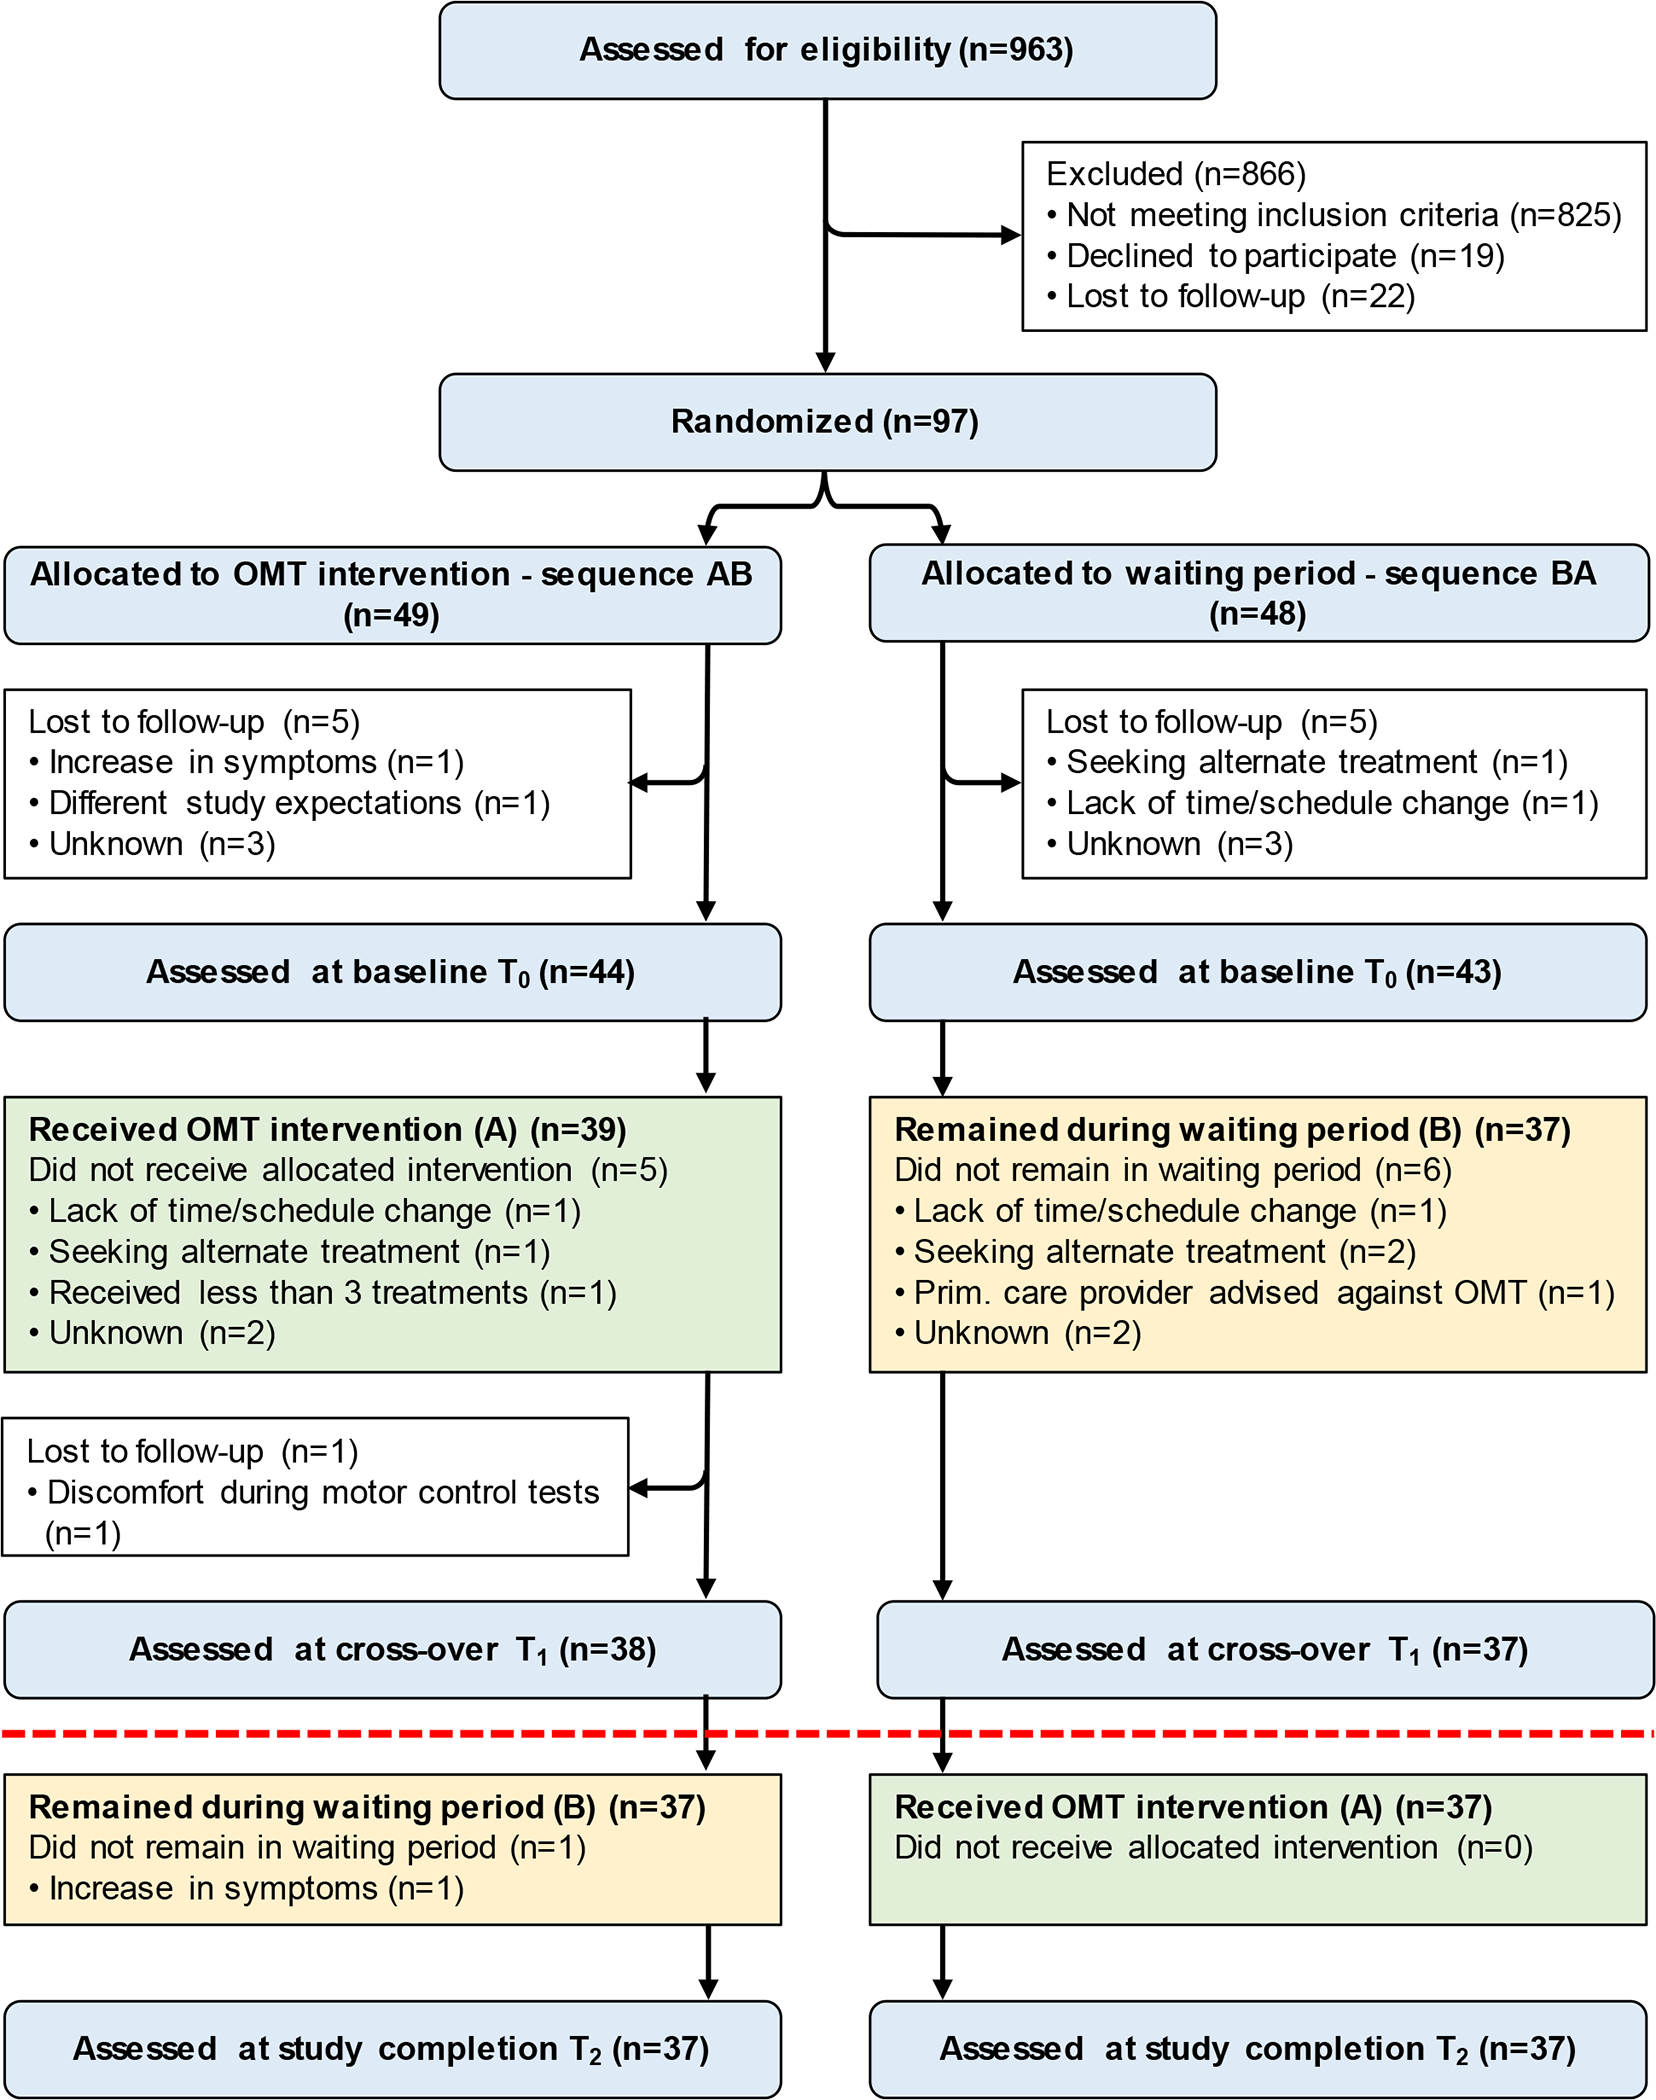
CONSORT flow diagram of participants. Because of the carryover effects in the primary outcomes, the comparison between study groups was carried out prior to the cross-over allocation at T1 (indicated with a red dashed line) with 38 participants in the immediate OMT intervention group and 37 participants in the waiting period group.