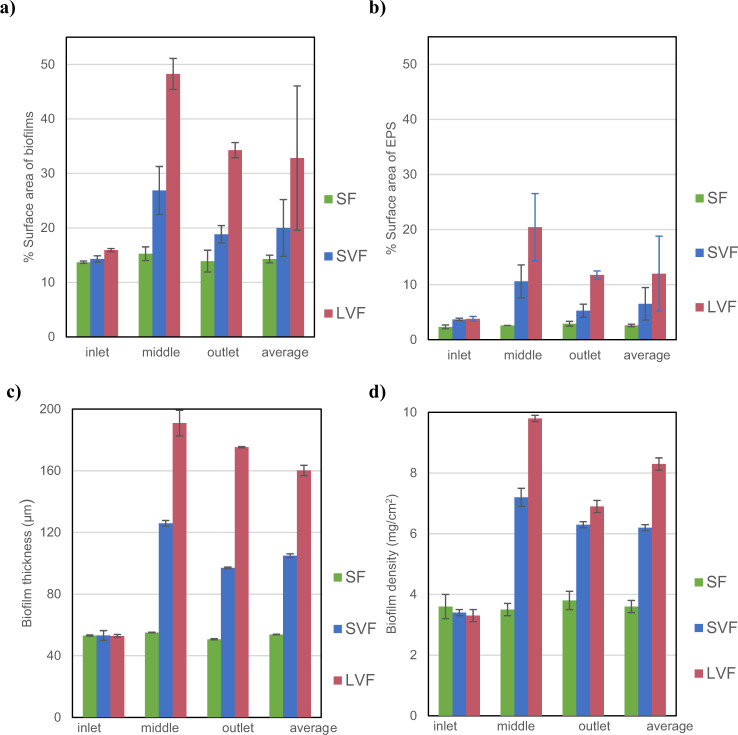
Fig. 4. Characteristics of the biofilms that accumulate on the slides on the channel walls for experiment set 1 at three different locations, inlet, middle and outlet, and the average across the whole wall.
a The percentage of the slide covered with biofilm. b The percentage covered by EPS alone. c The biofilm thickness. d The biofilm density. Note the spatially average density and thickness weighted to the values in areas where the coverage is highest. The error bars in the histrograms represent + /- one standard deviation.

