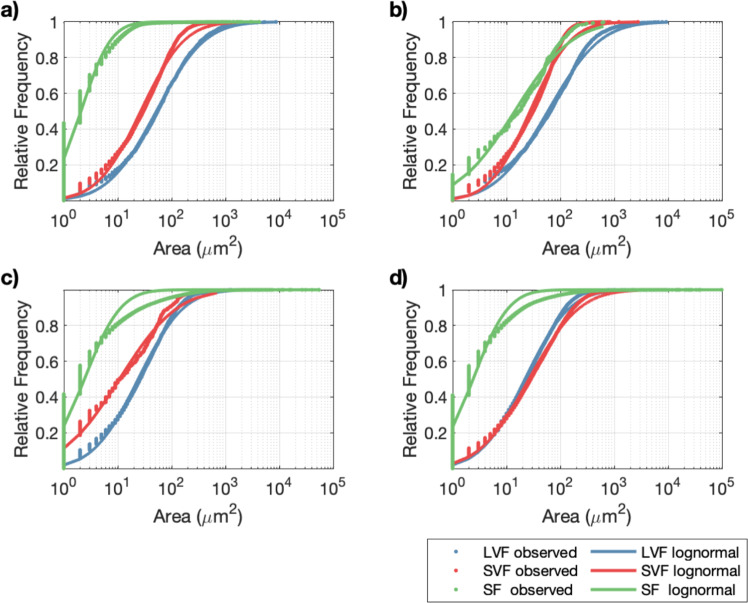
Fig. 6. Cumulative frequency distributions of the area covered by individual clumps when imaged by a microscope in experiment set 1 at the end of 4 weeks.
a biofilm (cells) on slides in the middle section of the channel. b EPS only on slides in the middle section of the channel. c biofilm on paper through which samples of the channel effluent was filtered. d EPS only on paper through which samples of the channel effluent was filtered.

