. 2020 Jun 23;10(40):23916–23929. doi: 10.1039/d0ra03133j

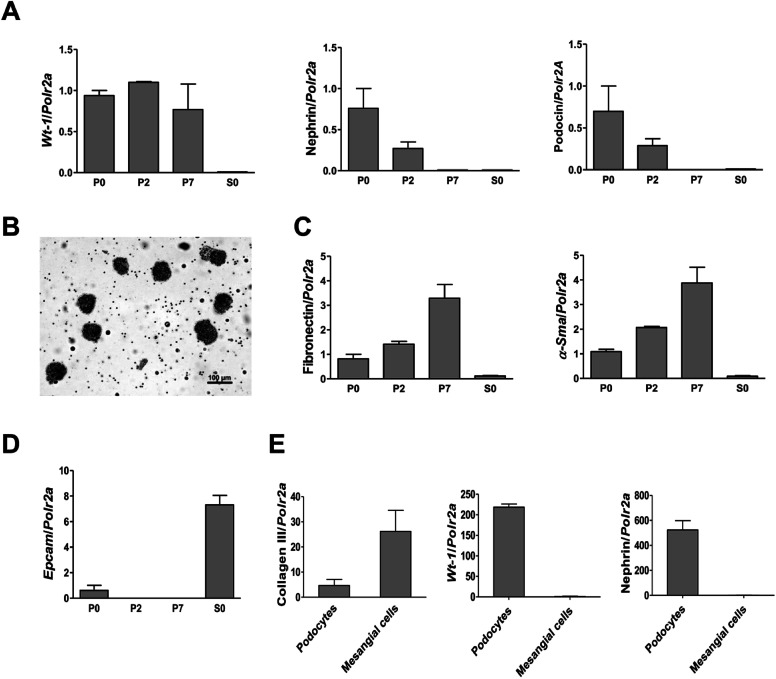
Fig. 1. Characterization of primary cultures of podocytes and mesangial cells isolated from mouse glomeruli. RT-PCR analysis of the podocyte specific markers Wt-1, nephrin, and podocin expression in primary podocytes (A). Representative image (scale bar 100 μm) of glomeruli after isolation with Dynabeads (B). Expression of fibronectin, smooth muscle α-actin (α-Sma) (C), and epithelial cell adhesion molecule (Epcam) (D) in primary podocyte culture. Comparison of collagen III, Wt-1, and nephrin expressions between primary cell cultures of podocytes and mesangial cells after the second passage (E). Data represent the mean ± SEM of three independent experiments. P0: primary podocytes grown out from glomeruli before passaging. P2: primary podocytes after two passages. P7: primary podocytes after seven passages. S0: supernatant fraction (=tubular part of nephrons after isolation).

Fig. 1