. 2020 Jun 23;10(40):23916–23929. doi: 10.1039/d0ra03133j

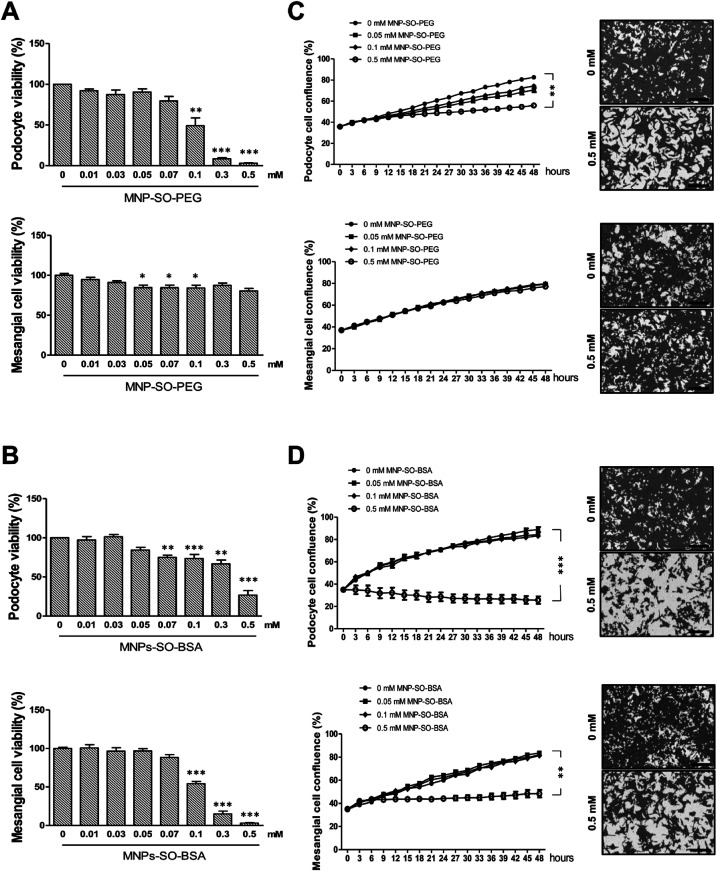
Fig. 2. MNPs exert different cytotoxic profiles on primary podocytes and mesangial cells. Cytotoxicity of MNPs on primary podocytes and mesangial cells determined by MTT assay for MNP-SO-PEG (A) and MNP-SO-BSA (B) shown as percentage of viable cells after 24 h exposure with indicated extracellular concentrations of nanoparticles. Real-time analysis of growth of primary podocytes and mesangial cells under influence of MNP-SO-PEG (C) and MNP-SO-BSA (D) in indicated extracellular concentrations of nanoparticles using IncuCyte ZOOM Imager for 48 h monitoring. Right panel images show confluency masking and measurement in cells from corresponding graph measurement in the absence (0 mM) and presence (0.5 mM) of MNPs. Scale bar represents 300 μm. The data are representative of three independent experiments and are means ± SEM. *P < 0.05, **P < 0.01, and ***P < 0.001 vs. corresponding non-exposed control.

Fig. 2