. 2020 Jul 17;10(45):26862–26873. doi: 10.1039/d0ra04250a

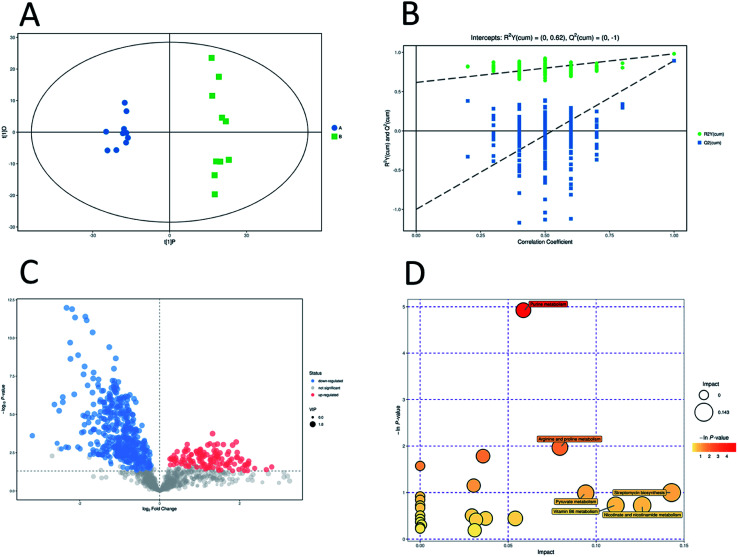
Fig. 5. Multivariate analysis of untargeted metabolomics data and pathway analysis in positive mode. OPLS-DA score plots of metabolic profiling of different groups (A). The corresponding 200 random permutations plots of the OPLS-DA models (B). Volcano plots for ESBL-EC vs. non-ESBL-EC (C). The relative metabolite level is depicted according to color scale. Red represents the upregulation and blue represents the downregulation of the metabolites in ESBL-EC vs. non-ESBL-EC. Large sizes represent high VIP values of metabolites. Overview of significantly changed pathway analysis for ESBL-EC vs. non-ESBL-EC (D). The x-axis represents pathway enrichment. The y-axis represents the pathway impact. Large sizes and dark colors represent the major pathway enrichment and high pathway impact values, respectively.

Fig. 5