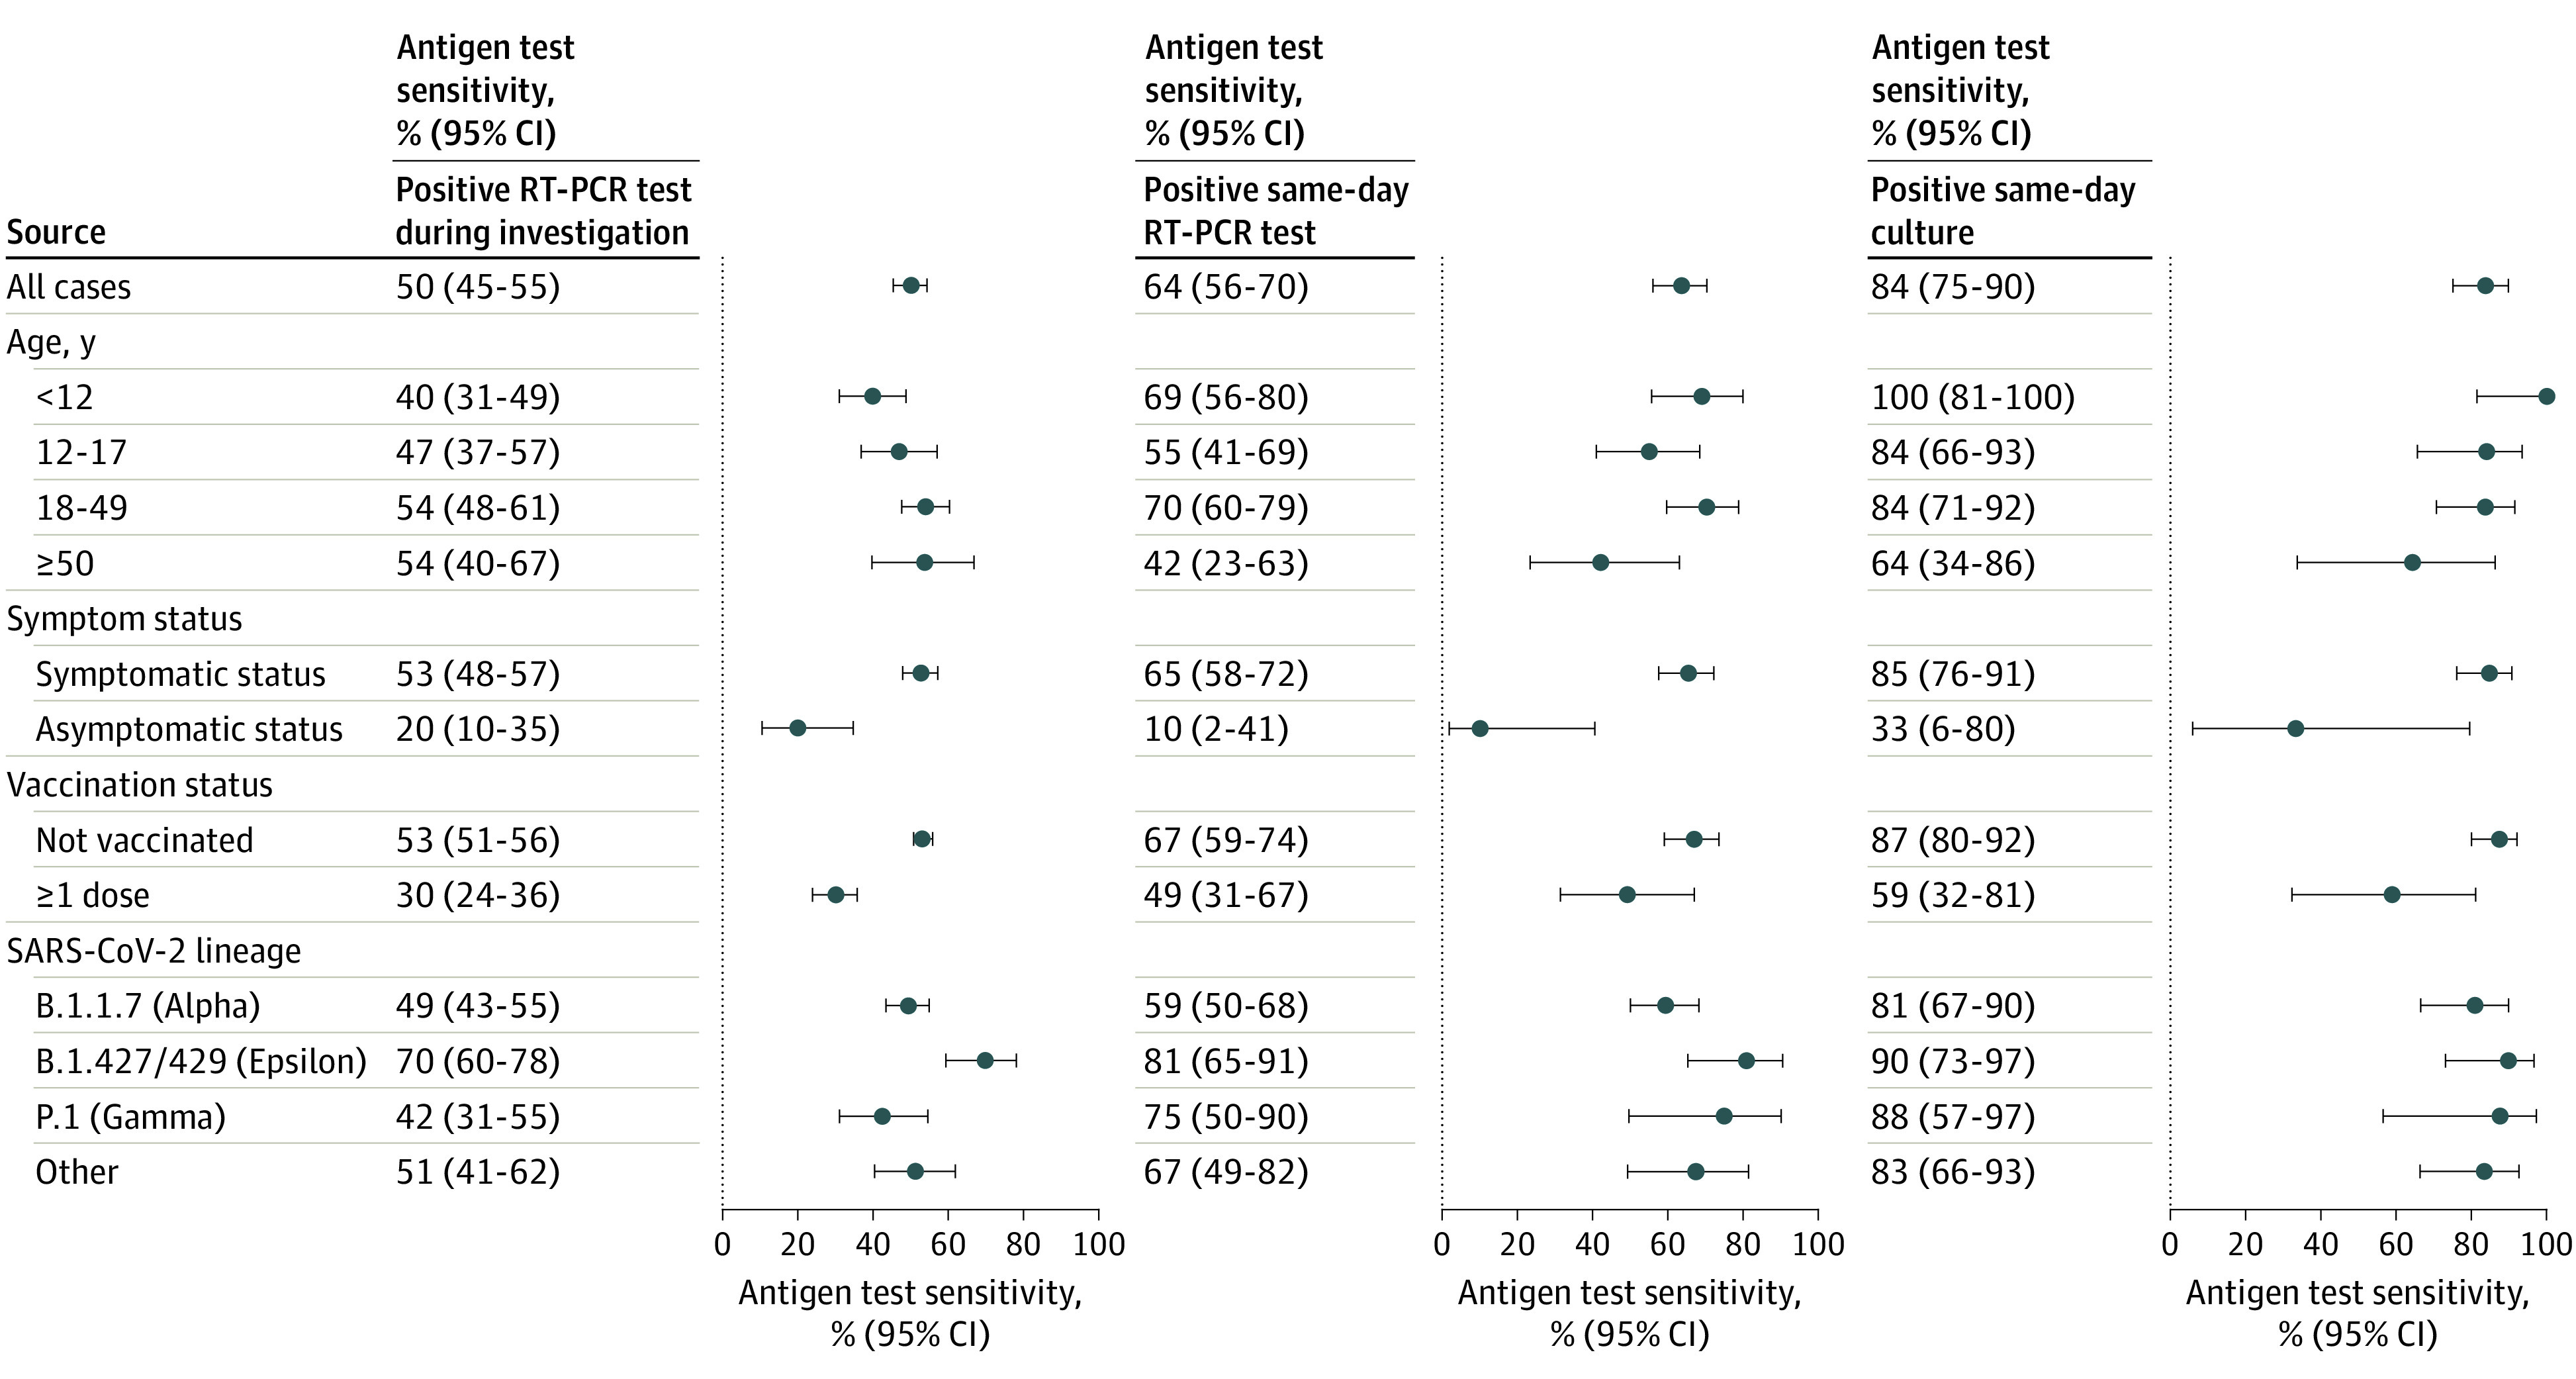
Figure 3. Sensitivity of Home Antigen Tests Compared With 3 Reference Standards.

Sensitivity (dots) and 95% CIs (error bars) of home antigen tests compared with 3 reference standards: a positive reverse transcription–polymerase chain reaction (RT-PCR) test at any time during the investigation, a positive RT-PCR test collected the same day as the antigen test, and a positive viral culture collected the same day as the antigen test. Results are displayed for all cases and subgroups as defined by age, symptom status, vaccination status, and SARS-CoV-2 lineage. Participants were considered symptomatic if they reported symptoms that fulfilled clinical criteria for COVID-19 adopted by the Council of State and Territorial Epidemiologists on August 5, 2020 (https://ndc.services.cdc.gov/case-definitions/coronavirus-disease-2019-2020-08-05/). Symptoms were captured via the enrollment questionnaire and daily symptom questionnaires during the 15-day enrollment period. Vaccination status was defined at the time of enrollment. Confidence intervals were calculated using Wilson score intervals with cluster-robust standard errors accounting for correlation of tests performed by the same participant. For participants younger than 12 years, the 95% CI for antigen test sensitivity compared with a positive same-day viral culture was calculated without cluster adjustment as all tests were contributed by unique participants.
