. 2020 Jul 21;10(46):27305–27314. doi: 10.1039/d0ra03210g

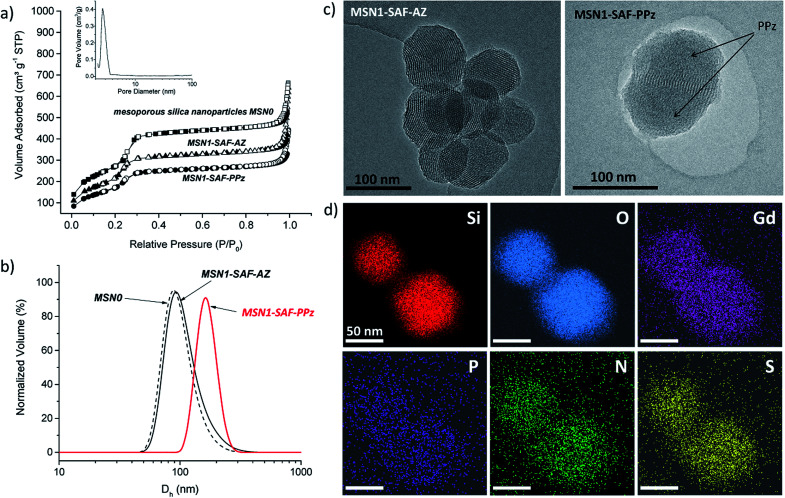
Fig. 3. (a) Nitrogen adsorption–desorption isotherms of materials MSN0, MSN1-SAF-AZ and MSN1-SAF-PPz. Full symbols and empty symbols stand for adsorption and desorption respectively, inset: BJH pore size distribution of MSN0; (b) dynamic light scattering (DLS) measurements (hydrodynamic diameter, Dh, via normalized volume) of MSN0, MSN1-SAF-AZ and MSN1-SAF-PPz (1 mg mL−1 aqueous suspension); (c) TEM images of the safranine-loaded nanoparticles MSN1-SAF-AZ and MSN1-SAF-PPz, where the polymer was located on the surrounding of the silica surface blocking the pores, marked by arrows in the right image. Scale bar: 100 nm; (d) TEM-EDX mapping images of nanoparticles MSN1-SAF-PPz stained with Uranyless (uranium-free staining contrast solution). Gd element was used as contrast agent, highly staining the organic parts of the system. Scale bar: 50 nm.

Fig. 3