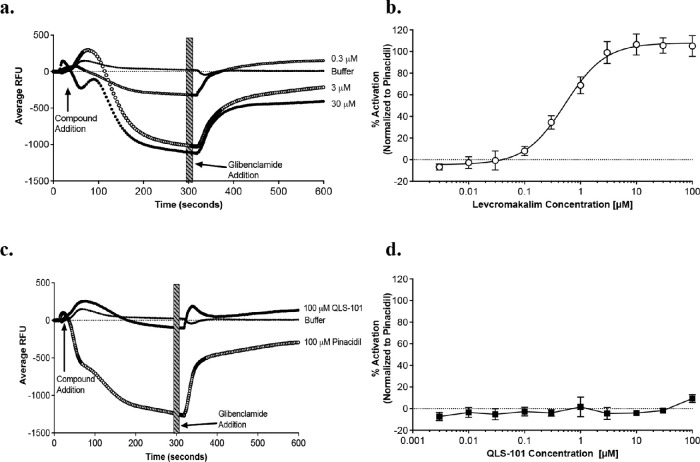
Figure 2.
Concentration-dependent membrane hyperpolarization of HEK-hKIR6.2/SUR2B cells by various compounds. (A, C) Averaged FLIPR traces of membrane potential response to (A) levcromakalim (n = 4), or (C) QLS-101 (n = 4) compared to the buffer control as indicated. Arrows indicate time of either addition of test compound or the KATP channel blocker glibenclamide (10 µM). Thick striped bar indicates the time range that was exported for EC50 calculation. The KATP channel opener pinacidil (100 µM) was included as a positive control in the QLS-101 assay as indicated (n = 4-6 replicates per group). (B, D) Concentration dependence of activation-averaged data across replicate testing days. Data points for individual batches are mean ± SD for six replicates recorded across two separate experimental days.

