Figure 6.
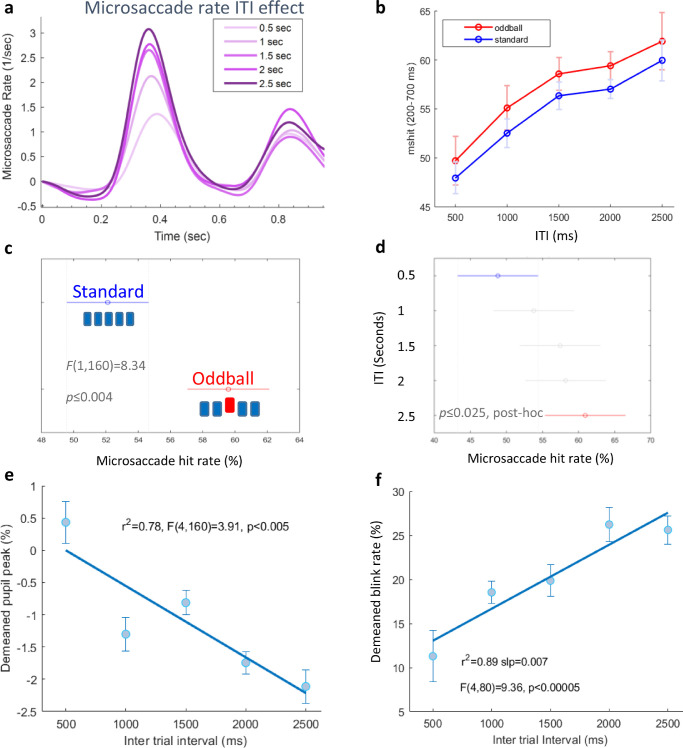
The effect of the inter-trial interval (ITI). (a) Baseline-corrected microsaccade rate modulation for different ITIs, standard and oddball combined. (b) Percentage of trials with microsaccade (msHit) at a window of 200 to 700 ms after stimulus onset for all conditions. (c) Two-way ANOVA and post hoc tests results for the oddball versus standard in all the ITIs (0.5, 1, 1.5, 2, and 2.5 seconds) combined (F(1,160) = 8.34, p < = 0.004)). (d) Two-way ANOVA (F(4,160) = 2.62, p < = 0.037) and post hoc tests results showing a significant difference between the ITI = 0.5 seconds and ITI = 2.5 seconds conditions. (e) Pupil area peak (% change relative to the 100 ms pre-stimulus) measurements, demeaned and re-adjusted with the grand average (see the Methods), as a function of the inter-trial interval, showing a negative correlation (F(4,160) = 3.91, p < 0.005). (f) Blink rate (%), demeaned and readjusted with the grand average, showing a positive correlation with ITI (F(4,80) = 9.36, p < 0.00005).

