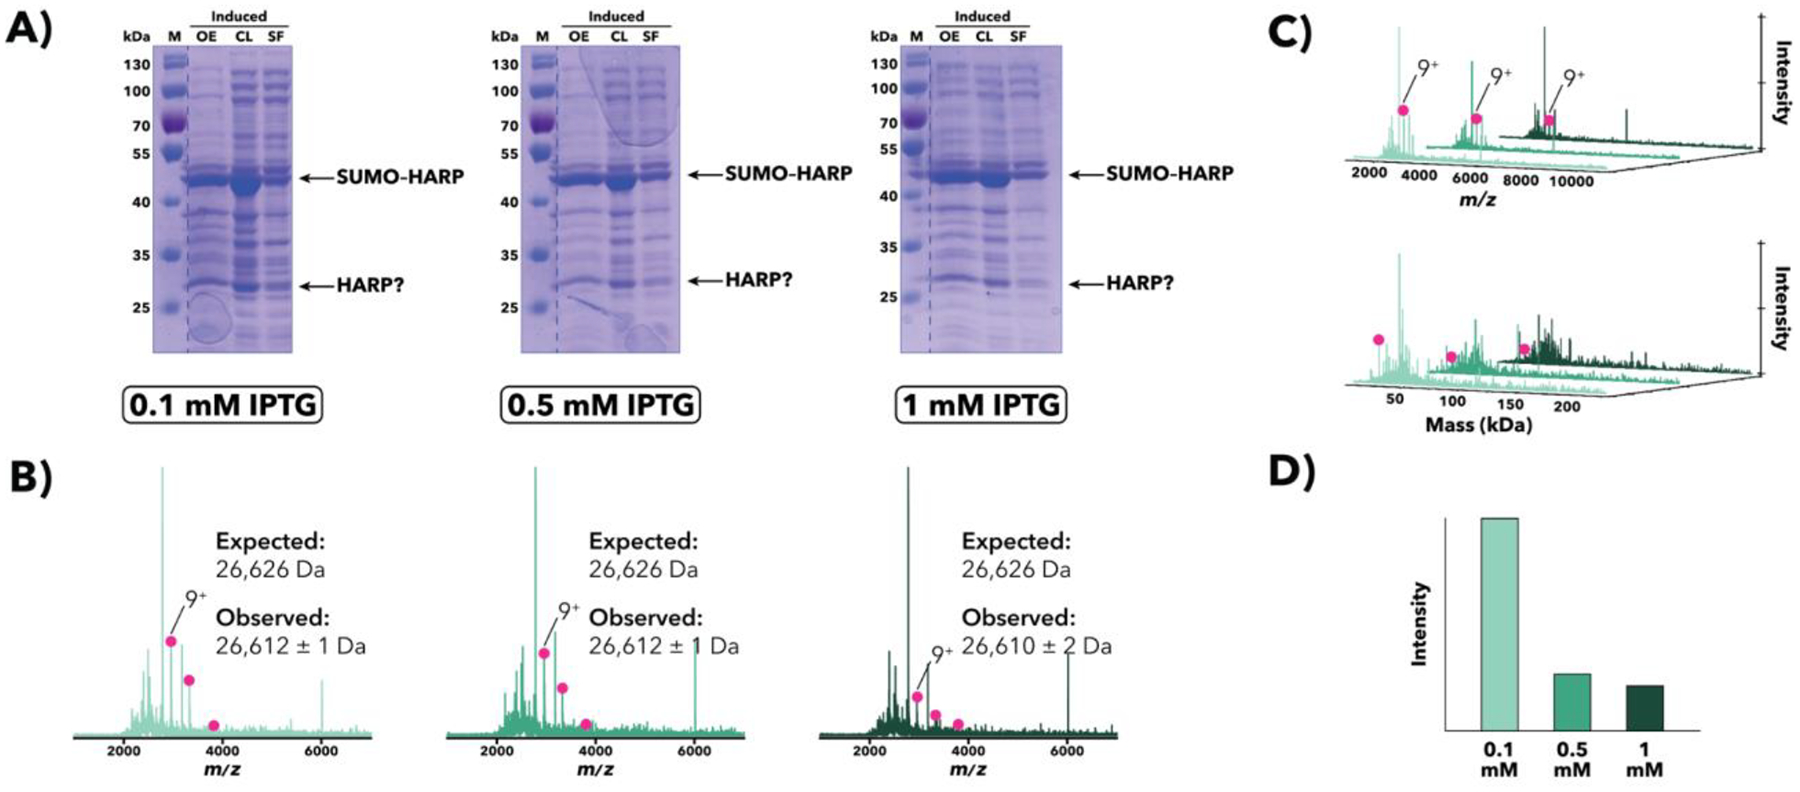
Figure 6.

Comparison of M. jannaschii SUMO–HARP overexpression samples induced with either 0.1, 0.5, or 1 mM IPTG. (A) SDS-PAGE [10% (w/v) polyacrylamide] analysis of post-induction samples at sequential stages of processing. Apparent bands corresponding to full-length SUMO–HARP as well as non-SUMO-tagged HARP are indicated. (B) IMAC-OBE-nMS analysis of soluble fractions using a 500 mM ammonium acetate mobile phase. Mass spectra (IST 100 V, HCD CE 5 eV) for 0.1 mM (light green), 0.5 mM (middle green), and 1 mM (dark green) IPTG are shown. While no apparent full-length SUMO–HARP is present in the spectrum, there is some non-SUMO-tagged HARP (pink circles). The charge state distribution for non-SUMO-tagged HARP is indicated, and the main charge state is labeled. The y-axis (not shown) represents relative intensity. (C) Waterfall plots showing m/z (top) and deconvolved mass (bottom) data. The main charge state (top) and deconvolved mass (bottom) for non-SUMO-tagged HARP is labeled. (D) Relative abundance of non-SUMO-tagged HARP across all samples, as quantified using MetaUniDec software.
