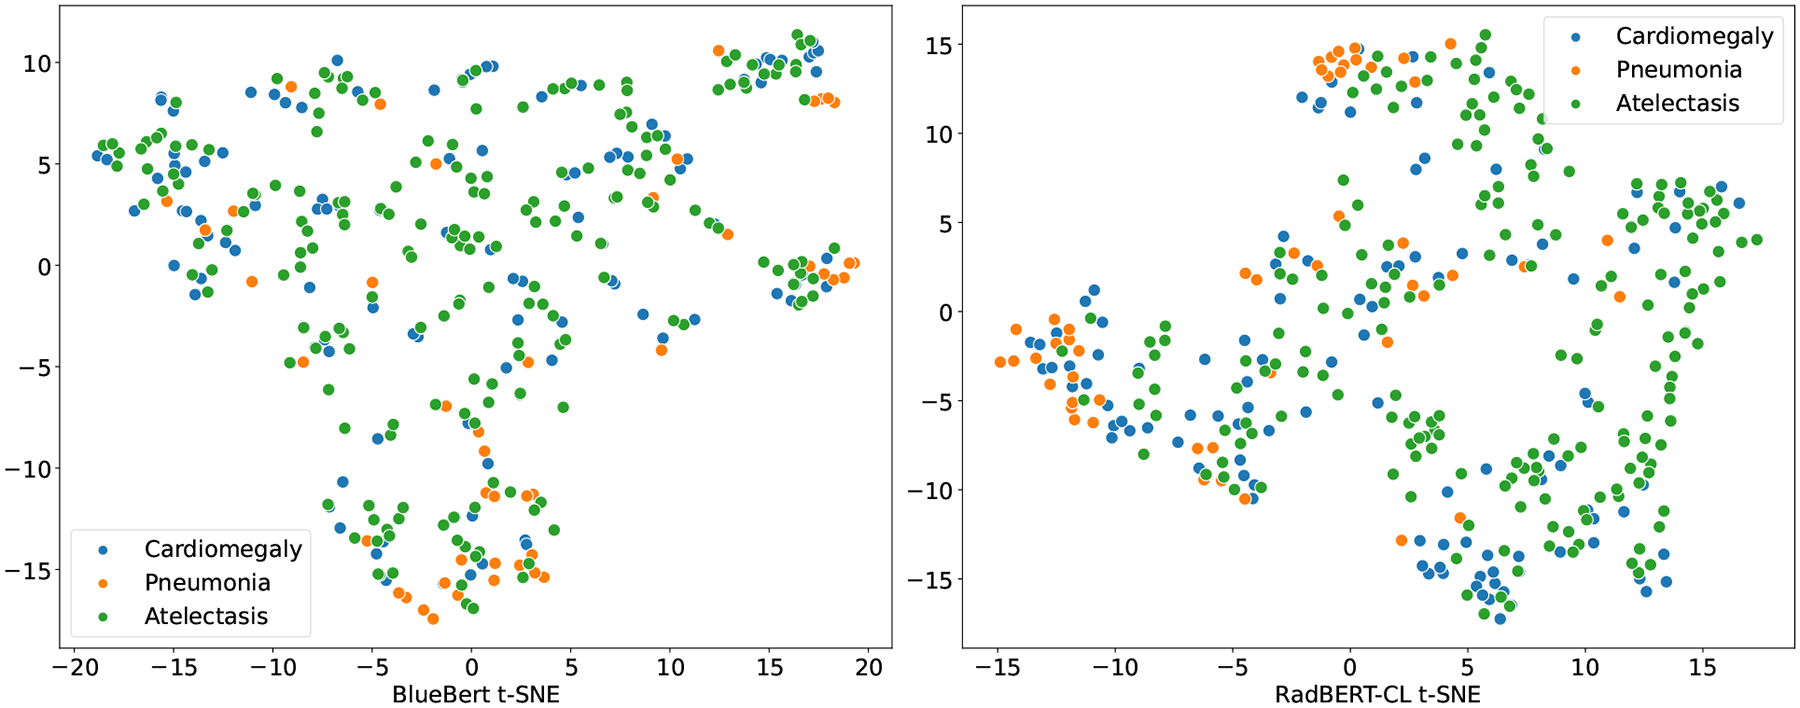
Figure 2:

t-SNE visualization of BlueBert and RadBERT-CL(Algorithm 3) for radiology reports annotated positive for three major diseases (Cardiomegaly, Pneumonia, and Atelectasis). Note that the reports used for generating the t-SNE plot are sampled from 687 radiologists annotated test set which are not used in RadBERT-CL pre-training. From the figure, it is evident that embeddings generated after pre-training RadBERT-CL with contrastive learning, is more informative compared to BlueBert on unseen data.
