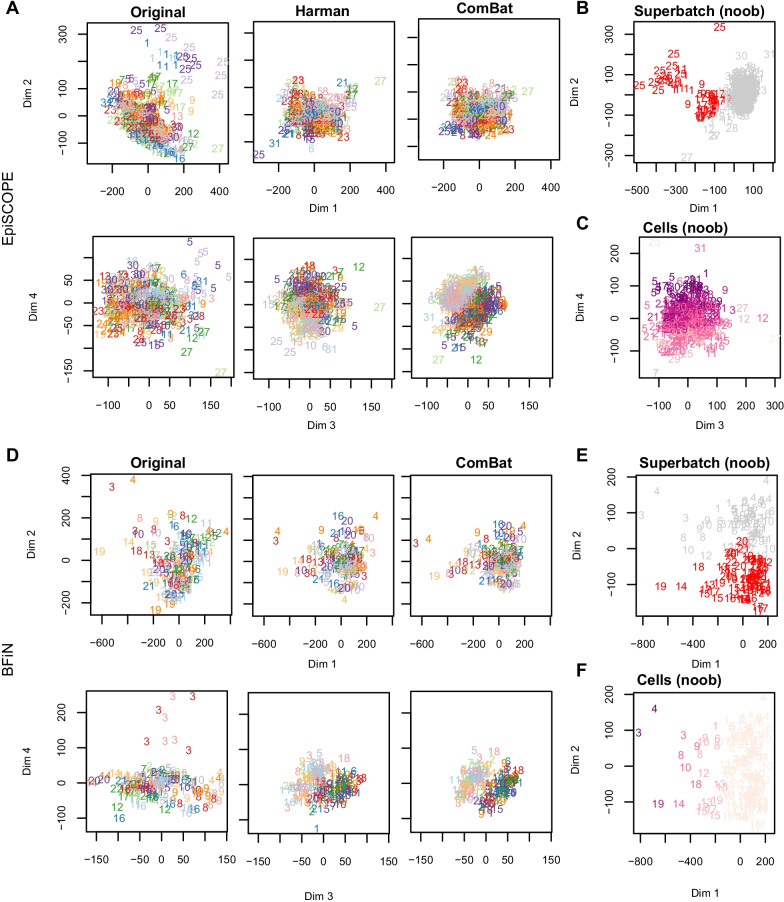
Fig. 5.
Principal component analysis of the EpiSCOPE and BFiN data. PCA was conducted on the original raw preprocessed M values and again after correction via Harman or ComBat. The data are presented with the number and colour signifying BeadChip slide identifier and the bold and pastel shading signifying male and female gender, respectively. PCA was also conducted on noob preprocessed data and coloured by slides of note across processing runs (those slides highlighted in gold in Fig. 3), or estimated cellular fraction. For the EpiSCOPE data (a), dimensions 1 and 2 of the PCA plots show the data to separate by slide. This was particularly evident in slides 1 and 25 and less so for slides 9 and 17. Arrays from slide 5 separated out discretely on dimension 4. The PCA plots of Harman or ComBat corrected data show the absence of data separation by slide; instead the corrected data show a strong separation by gender in principal dimensions 3 and 4, despite the data being limited to autosomal probes only. Separation of the data by DHA supplementation (experimental treatment) was not apparent in the principal components examined. b Consistent with the control probe findings, the 450K slides with high technical variation (slides 1, 5, 9, 17, 25) are the first arrays processed in each processing run. c Some separation of the data on the fourth dimension by the estimated proportion of neutrophils in the blood sample was observed. In the BFiN data PCA analysis (d), there was not obvious separation of the raw preprocessed data by slide identifier on dimensions 1 and 2. However, slide 3 clearly separated out on dimension 4. Batch correction via Harman or ComBat was sufficient to remove the separation of slide 3. The PCA plots of noob preprocessed data illustrate the two largest factors influencing the autosomal probes; e the eigenvalues for dimension 2 showed two clouds of samples—one for slides 1–12 and the other, slides 13–22 and f cellular composition—with saliva samples containing a higher immune cell component separating out on dimension 1. Within each of these two clouds there was further structure, with samples from some slides clustering together. For the BFiN data, the technical (batch) variation is largely due to processing run (superbatch) and less so, the individual slides

