Figure 1.

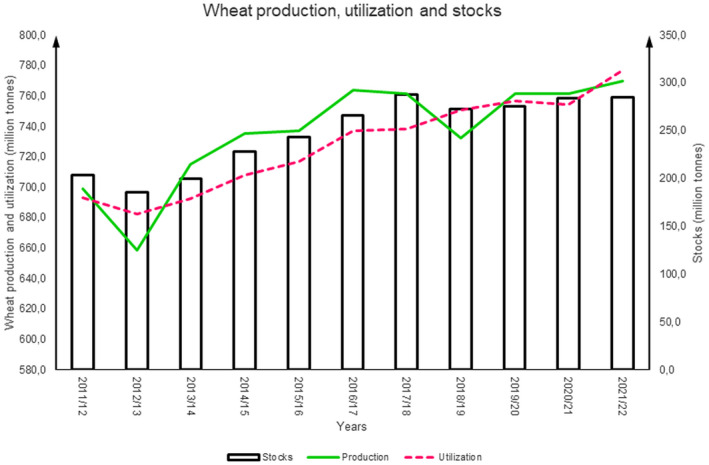
Evolution of wheat production (green line), utilisation (red dashed line) and stocks (black bars) between 2011 and 2021 in the world (in million tons). The data come from the site http://www.fao.org/worldfoodsituation/csdb/en/.

Evolution of wheat production (green line), utilisation (red dashed line) and stocks (black bars) between 2011 and 2021 in the world (in million tons). The data come from the site http://www.fao.org/worldfoodsituation/csdb/en/.