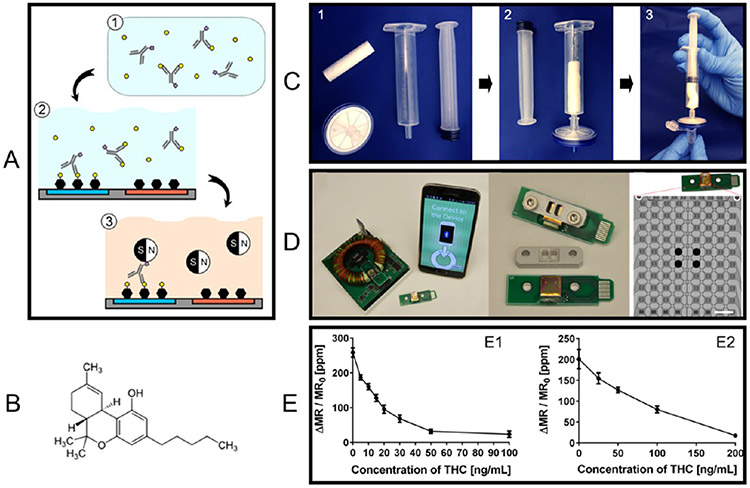
Figure 11.
(A) GMR-based competitive assay for the detection of small molecule THC. (B) Chemical structure of THC. (C) Saliva collection scheme and step. (D) GMR biosensor platform with a smartphone interface (left), GMR signal reader with a dimension of 105 mm × 90 mm (middle), and GMR biosensor array consisting of 80 sensors. (E) THC assay concentration curves. GMR signal collected from filtered saliva samples with (E1) 15 min preincubation and 15 min chip incubation and (E2) 0 min preincubation and 2 min chip incubation. The error bars represent standard deviations of eight identical sensor signals. Figure reprinted with permission from ref 84. Copyright 2016 American Chemical Society.

