. 2020 Aug 4;10(48):28786–28797. doi: 10.1039/d0ra04361c

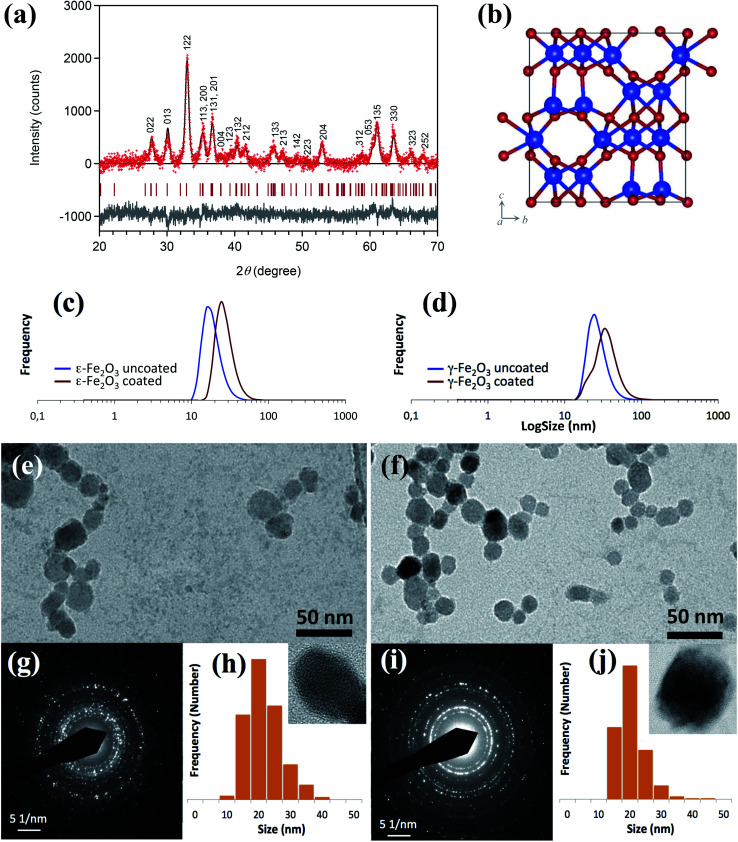
Fig. 2. (a) XRD pattern with Rietveld analysis of ε-Fe2O3 NPs. Red dots, black lines, and grey lines are the observed patterns, calculated patterns, and their differences, respectively. Red bars represent the calculated positions of the Bragg reflections of the ε-Fe2O3 phase (orthorhombic, Pna21). (b) Crystal structure of ε-Fe2O3. Blue and red balls indicate Fe and O atoms, respectively. (c) Distribution of hydrodynamic diameters, DH, from dynamic light scattering (DLS) measurements of coated and uncoated ε-Fe2O3 NPs and (d) γ-Fe2O3 NPs. (e) TEM images of ε-Fe2O3 NPs and (f) γ-Fe2O3NPs. (g) ED patterns of ε-Fe2O3 NPs. (h) Particle size histograms from TEM images of ε-Fe2O3 NPs, in the inset HRTEM image of a single NP. (i) ED patterns of γ-Fe2O3 NPs. (j) Particle size histograms from TEM images of γ-Fe2O3 NPs. In the inset, HRTEM images of a single NP.

Fig. 2