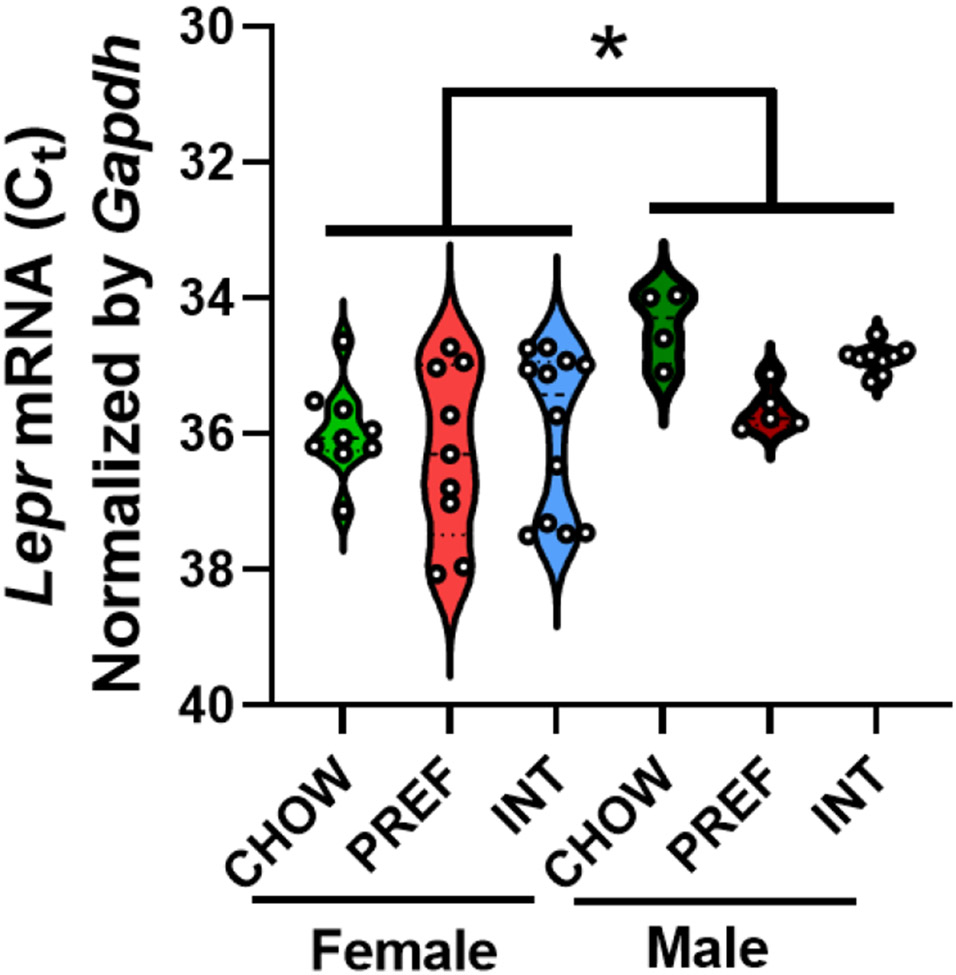
Figure 4: Leptin receptor expression in the anterior insula.
Violin plots with scatter show that male rats, regardless of diet schedule, had greater Lepr mRNA expression (i.e., lower Gapdh-normalized cycle thresholds [CT]) in the insula than females. Insular Lepr mRNA expression did not significantly differ with respect to diet group. The dashed line within the violin plots denotes the median and the dotted lines denote the 1st and 3rd quartile. *: p<0.05, n=4-12 per group.

