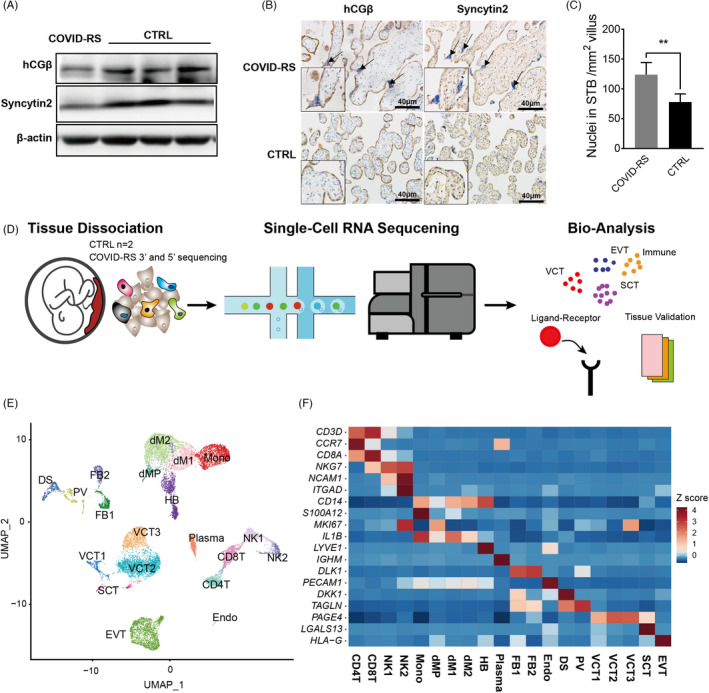
FIGURE 2.

The expression of syncytialization markers and single‐cell transcription atlas in COVID‐RS placenta. (A) The expression of syncytialization markers in COVID‐RS and CTRL placenta as measured by Western blotting; (B) localization of syncytialization markers in COVID‐RS and CTRL placenta. Arrows indicate syncytial knots; (C) The number of SCT nuclei per mm2 villus; (D) A schematic figure illustrating the workflow of tissue collection and single‐cell RNA sequencing; (E) UMAP of the cell clustering in the placentas enrolled in this study; (F) expression of classical marker genes in each cell subsets based on the z‐score calculation
